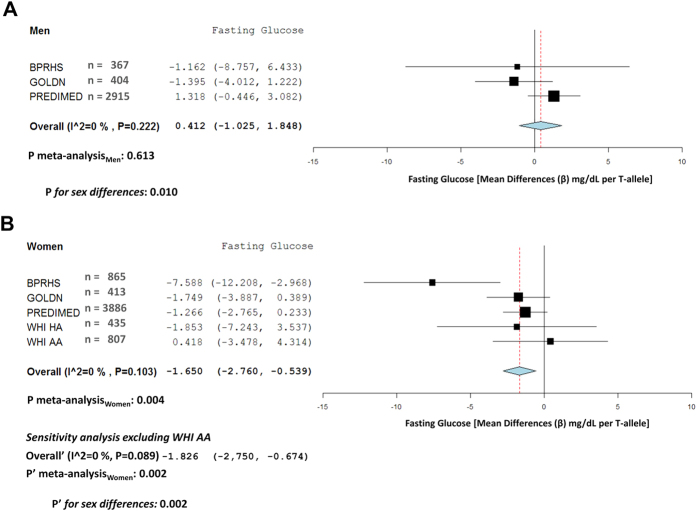
Figure 4. Meta-analysis of the association between the MCM6-rs3754686 polymorphism and fasting glucose according to sex in BPRHS, GOLDN, PREDIMED and WHI studies.
Forest plots: (A) men, (B) women, show adjusted regression coefficients and 95% CI (expressed in mg/dL and estimated per one copy of the T-allele; LCT genotypes coded as 0, 1, and 2 according to the number of T-alleles) for the corresponding intake in each study. The diamond shows the meta-analyzed associations in a fixed-effects model. The I2 statistic was calculated for heterogeneity. Pmeta-analysis indicates the P-value obtained in the meta-analysis including all populations. P’meta-analysis indicates the P-value for the meta-analysis obtained in the sensitivity analysis excluding the WHI AA women. P and P’ for sex differences indicate the P-values for heterogeneity by sex in the total (P) and the sensitivity (P’) meta-analysis.

