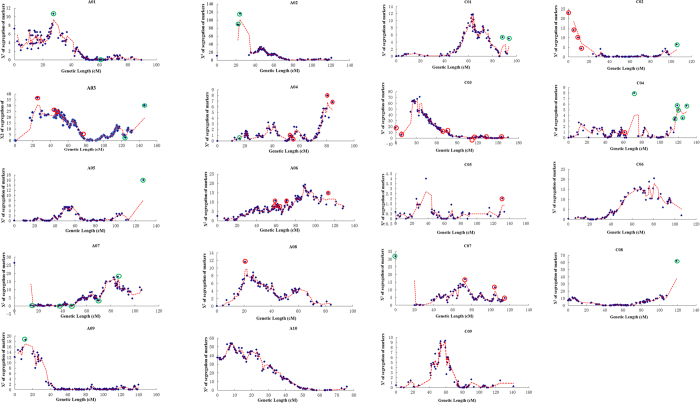
Figure 1. The segregation of markers on each linkage group of the Brassica napus TNDH 2109-map.
Chi-squared test: n = 2, df (degrees of freedom) = 1, P = 0.05, χ2 = 3.84, SD* = segregation distortion. When the segregation of markers was 3.84 the segregation ratio of Tapidor and Ningyou7 was 1:1. Red and green circles indicate the extreme markers skewed towards Tapidor and Ningyou7, respectively, which were deleted to construct the new 2041 map.

