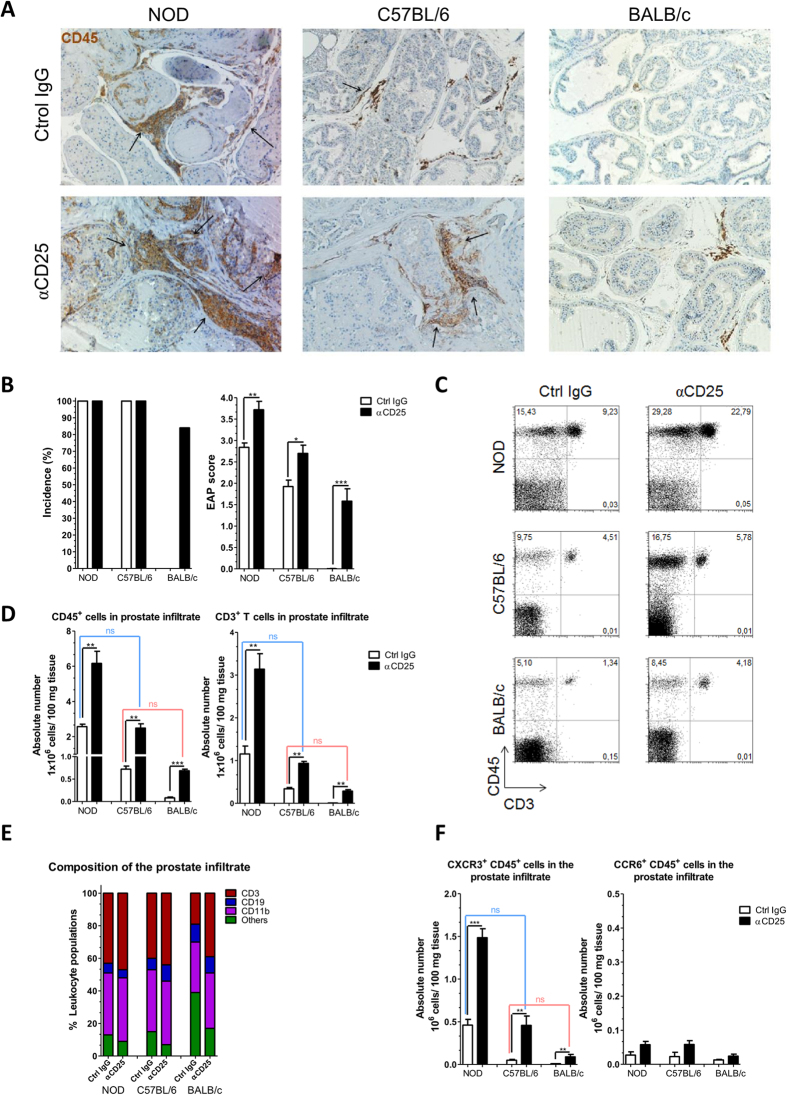
Figure 3. CD25 cell depletion promotes Experimental Autoimmune Prostatitis.
NOD, C57BL/6 and BALB/c mice were treated as in Fig. 1. (A) Representative immunohistochemistry assays for CD45+ cells in prostate tissue sections from NOD, C57BL/6 and BALB/c mice analyzed at day 24. Arrows indicate the CD45+ cell clusters infiltrating the prostate gland. Original magnification X200. (B) Incidence and prostate histological scores from mice under study. (C) Presence of leukocytes infiltrating the prostate gland from animals under study, representative dot plots CD45+ versus CD3+ cells. (D) Bar graphs shown absolute numbers of CD45+ and CD3+ cells infiltrating the prostate gland from animals under study. (E) Percentages of CD3+, CD19+, CD11b+ and others in the prostate infiltrate from animals under study. (F) Absolute number of CXCR3+ CD45+ and CCR6+ CD45+ cells infiltrating the prostate gland from mice under study. Data are shown as mean ± SEM, n = 6 mice per group, and are representative of two independent experiments. The p values were obtained using one-way ANOVA followed by Bonferroni post-hoc analysis; ns, non significant.

