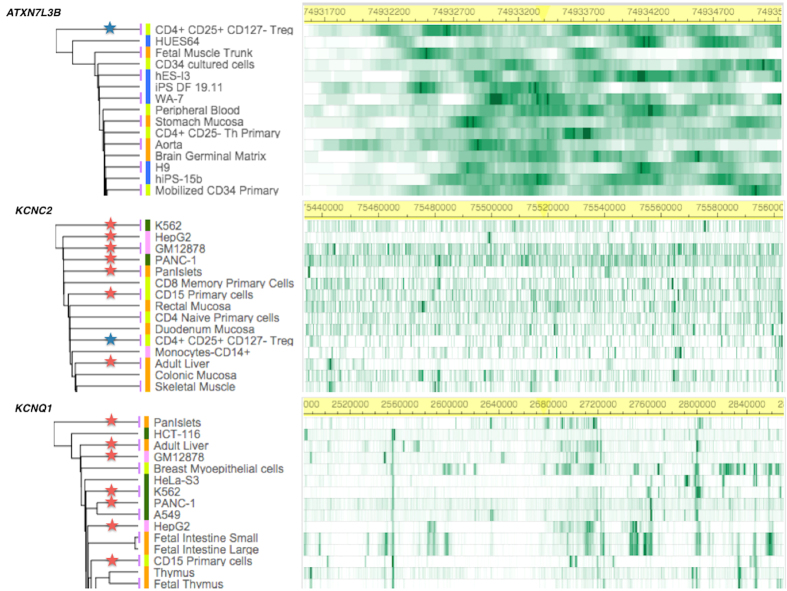
Figure 2. Epigenetic functional annotations using tissue-specific hierarchical clustering.
Based on the top-down approach, hierarchical clustering is applied to H3K4me1 (mark of regulatory elements associated with enhancers) using primary cells (light green), primary tissues (orange), and cell lines (blue), and cancer cells (green). H3K4me1 chromatin immunoprecipitation (ChIP)-seq read density (in green) is shown for each gene. A blue star indicates overlapping enrichment between ATXN7L3B and KCNC2. Red stars (n = 7) indicate overlapping enrichment between KCNC2 and KCNQ1.

