
Figure 4. An integrative functional network in an insulin-signaling pathway.
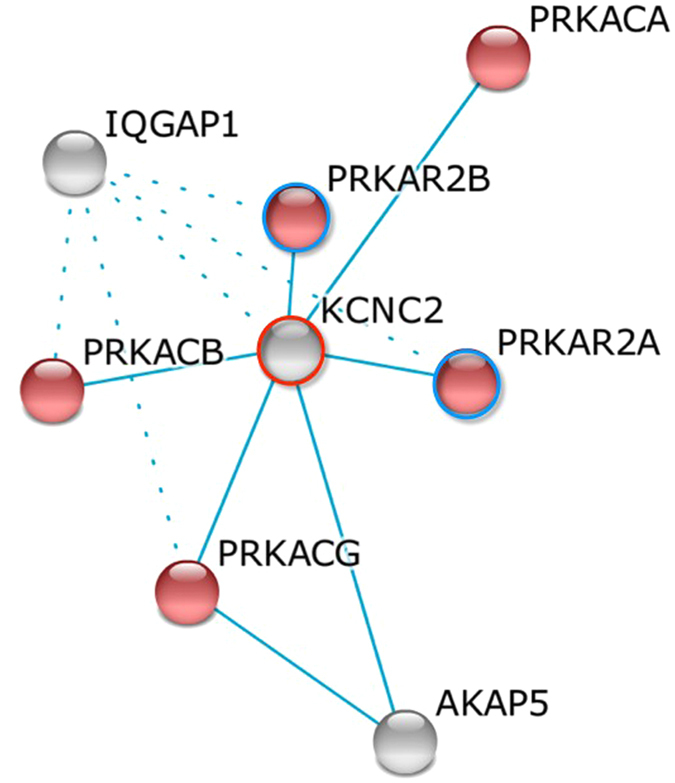
A gene network by k-mean clustering was constructed with insulin signaling pathway enrichment (red color, p = 8.2e-8). Filled colors indicate the genes up-regulated (blue circles) and down-regulated (red circles) by GEO expression analyses.