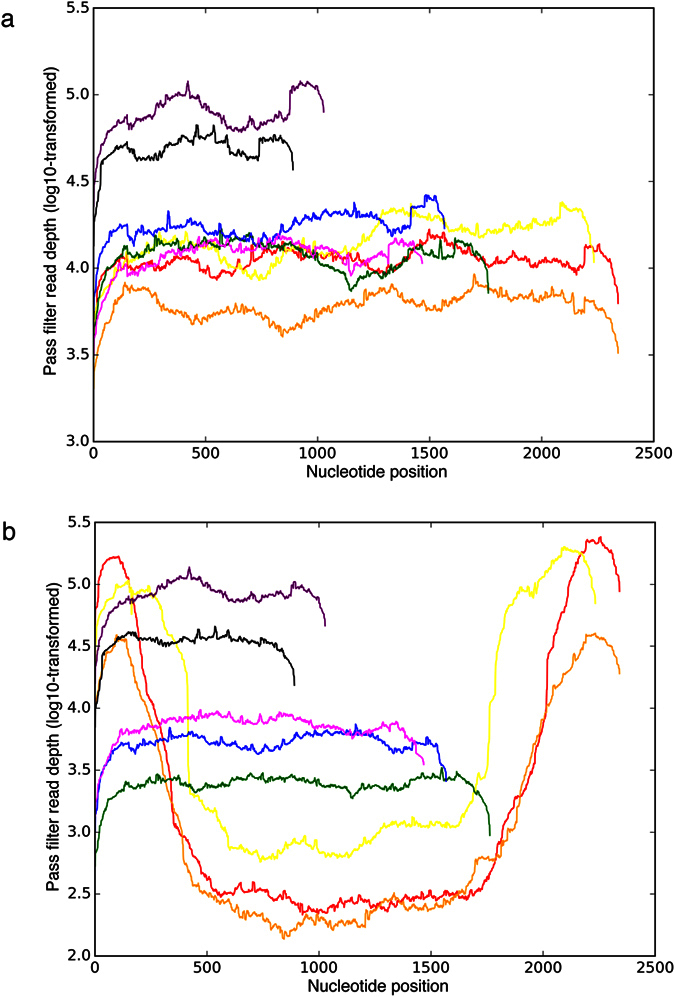
Figure 3. High-throughput sequencing results.

(a) Ideal sequencing coverage from influenza A/Singapore/H2009.334C/2009(H3N2) virus genome. Red, orange, yellow, green, blue, magenta, purple, and black plotted lines represent sequencing coverage (X-axis) and pass filter read depth (Y-axis) of the influenza A/H3N2 segment 1 (PB2 - polymerase basic 2, 2341 nt), segment 2 (PB1 - polymerase basic 1, 2341 nt), segment 3 (PA - polymerase acidic, 2233 nt), segment 4 (HA – hemagglutinin, 1762 nt), segment 5 (NP – nucleoprotein, 1566 nt), segment 6 (NA – neuraminidase, 1467 nt), segment 7 (MP - matrix protein, 1027 nt), and segment 8 (NS – nonstructural, 890 nt), respectively. (b) Suboptimal sequencing coverage for influenza A/Singapore/C2009.803bV/2009(H3N2) virus genome. Considerably higher read depths were observed in the 5′- and 3′-ends of segments 1 (red), 2 (orange), and 3 (yellow).
