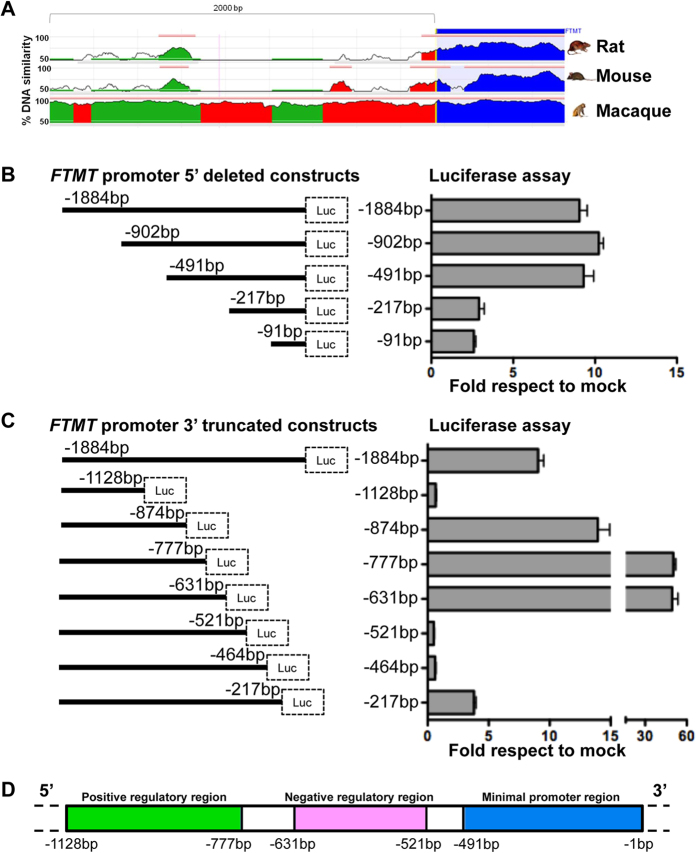
Figure 1. Promoter identification by in silico analysis and luciferase assay.
(A) Mammalian conservation of FTMT 5′ genomic sequence, corresponding to chr5:121185610:121189119 on Human GRCh37 Assembly (hg19). The conservation summary is adapted from ECR Browser47. (B) Luciferase assay on promoter sequence with 5′ and (C) 3′ deletions to identify the promoter activity. Left panels show the scheme of the constructs. Right panels show the quantification of luciferase emission with the indicated constructs normalized to empty vector. The plots represent the mean +/−SD of three independent experiments. (D) Scheme showing the position of positive (green) and negative (pink) regulatory and minimal promoter (blue) regions, resulting from luciferase assay.

