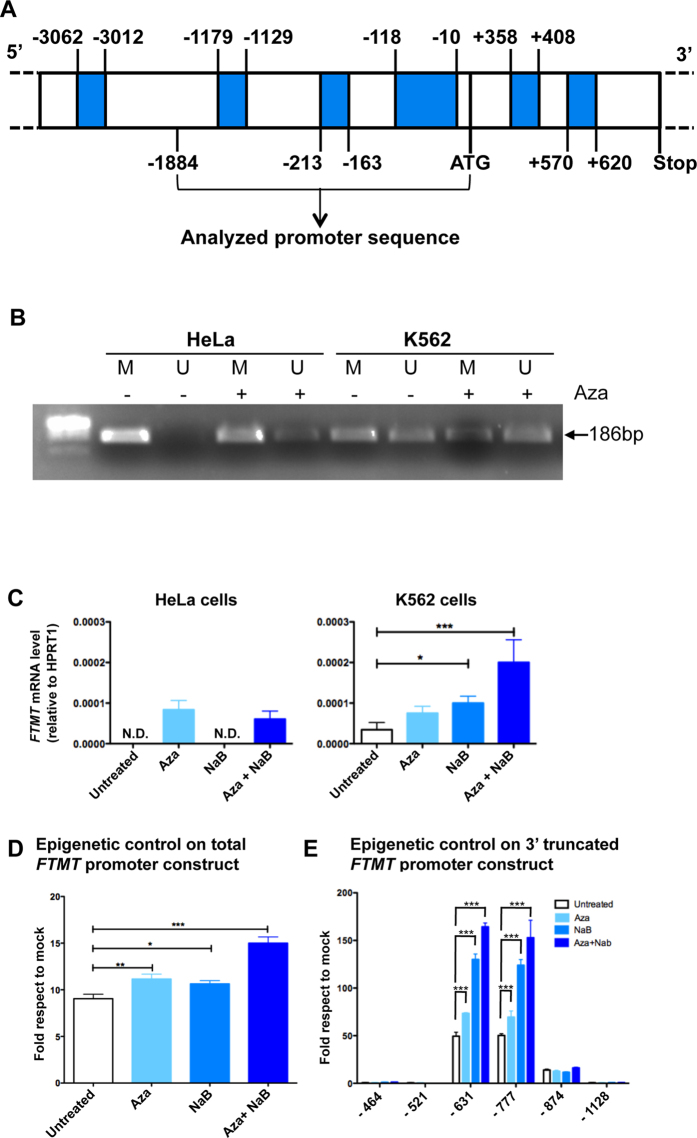
Figure 3. Epigenetic control of FTMT expression.
(A) Schematic representation of the putative methylated regions in the FTMT promoter predicted by UCSC Genome Browser. Regions that can be methylated are shown in blue, numbers indicate position on the sequence respective to ATG, starting and stop codons (ATG and Stop, respectively) are indicated. (B) Methylation specific PCR showing methylated (M) and unmethylated (U) DNA in HeLa and K562 cells, untreated (−) or treated (+) with 5 μM Aza for 72 h. Arrow indicates PCR product size. (C) Expression of FTMT by qRT-PCR in HeLa and K562 cells untreated, treated with the demethylating agent (5 μM Aza), with the histone deacetylase inhibitor (1 mM sodium butyrate, NaB) or both for 72 h. The plots represent the mean +/−SD of three independent experiments in triplicate, analyzed with One-way Anova with Bonferroni post test, *p < 0.05, ***p < 0.001. (D) Luciferase assay of the putative promoter region to evaluate epigenetic contribution to FTMT expression in K562 cells. Luciferase activity of the full promoter region in basal condition (Untreated) or after treatment as in panel C. The plots represent the mean +/−SD of three independent experiments in triplicate, analyzed with One-way Anova with Bonferroni post test, *p < 0.05, **p < 0.01, ***p < 0.001. (E) Luciferase activity of promoter region with 3′ deletions upon treatment described in panel C. The plots represent the mean +/−SD of three independent experiments in triplicate, analyzed with Two-way Anova with Bonferroni post test, ***p < 0.001.

