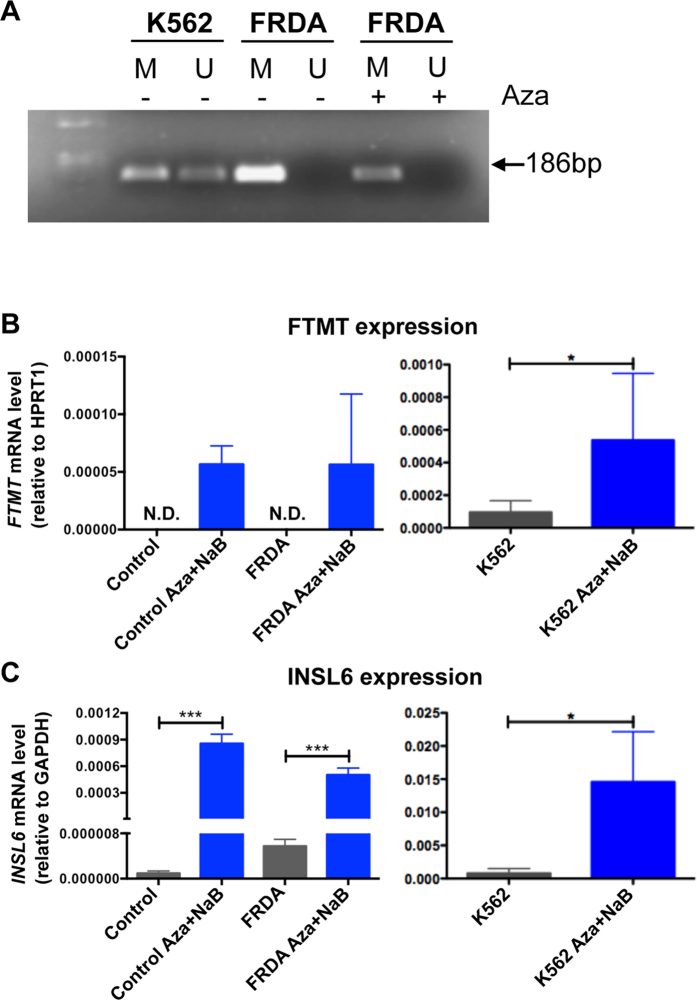
Figure 4. FTMT expression in Friedreich ataxia fibroblasts and K562 cells.
(A) Methylation specific PCR showing methylated (M) and unmethylated (U) DNA in untreated (−) K562 cells and in primary fibroblasts from a FRDA patient untreated (−) or treated (+) with 5 μM Aza for 72 h. Arrow indicates product size. (B) mRNA level of FTMT in control and FRDA fibroblasts and K562 cells treated for 72 h with 5 μM Aza and 1 mM NaB analyzed by qRT-PCR. (C) The expression of INSL6 gene is analyzed to confirm effective demethylation. The plots represent the mean +/−SD of three independent experiments in triplicate, analyzed with Mann-Whitney test *p < 0.05, ***p < 0.001.

