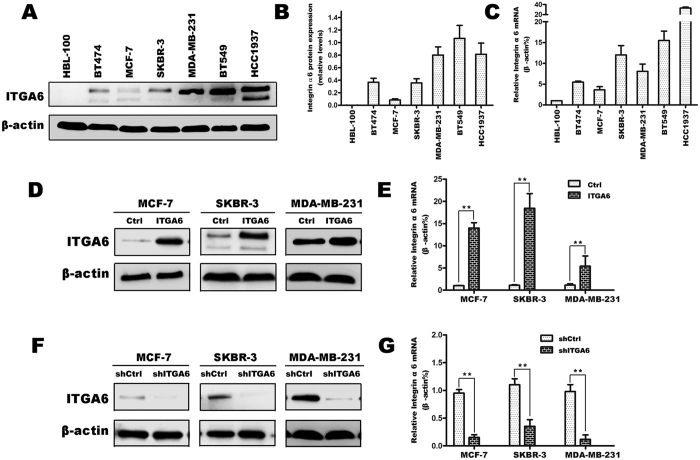
Figure 1. Protein and mRNA expression level of ITGA6 in breast cancer cell lines.
(A,B) Western blot analysis of ITGA6 expression in HBL-100, MCF–7, MDA-MB-231, HCC1937, SKBR-3, BT474 and BT549 group with ITGA6 antibody. β-actin served as loading control. The intensity of ITGA6 was quantified by densitometry (software: Image J, NIH). (C) Relative ITGA6 mRNA expression levels were determined using RT-PCR. β-actin mRNA was used as the internal control. (D,E) Western blot and RT-PCR analysis to measure the protein and mRNA levels of ITGA6 in breast cancer cells transfected with LZRS-IRES-zeo-α6 and LZRS-IRES-zeo vectors for MCF7, SKBR-3 and MDA-MB-231 cells lines. (F,G) Western blot and RT-PCR analysis of ITGA6 in the ITGA6 knockdown and control shRNA group. All experiments were carried out in triplicate. Data are presented as mean ± SD (n = 3). **P < 0.01 in comparison with respective group.

