Figure 1.
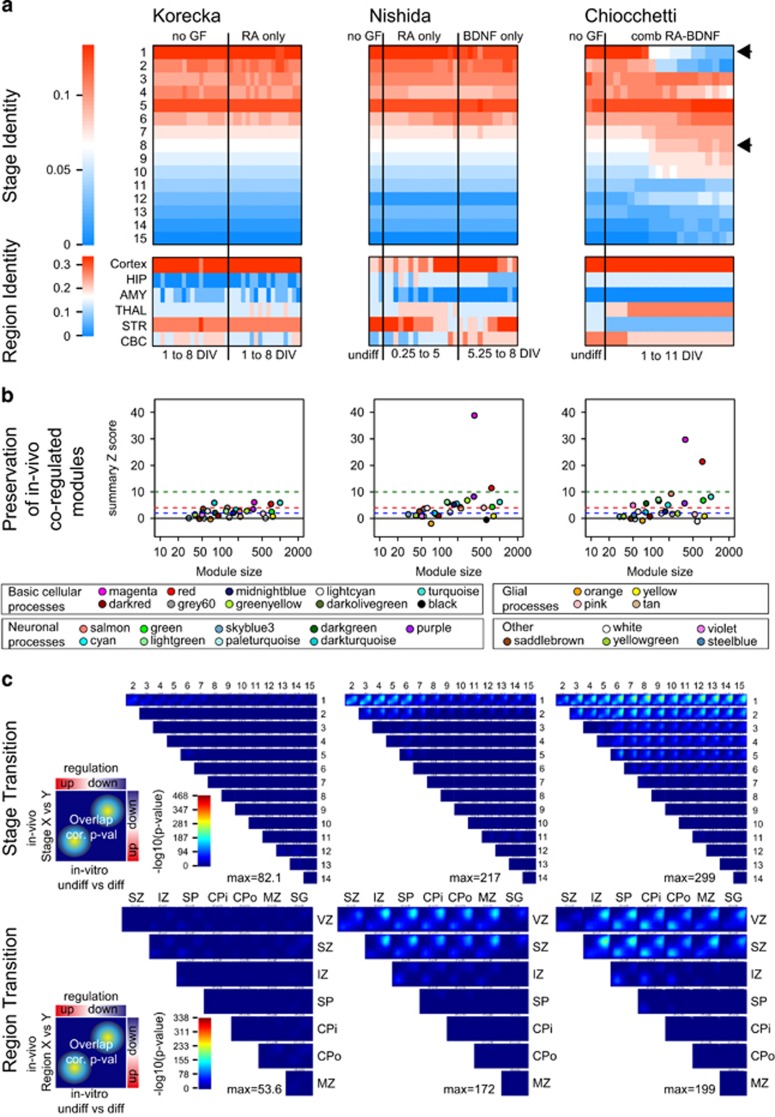
Evaluation of neuronal differentiation comparing three SH-SY5Y protocols. (a) CoNTExT analysis comparing mRNA signatures previously published (Korecka; Nishida) and generated here (Chiocchetti). mRNA signature of the cells (Chiocchetti data set) differentiated by continuous exposure to retinoic acid (RA) and brain-derived neurotrophic factor (BDNF) was showing a more mature phenotype than the other two sets. Our data set was most similar to the cortical area and was reminiscent of 15–19 weeks post conception (Stage 5) or above. In addition, our data set showed no reminiscence for earlier stages after 11 days in vitro (DIV; see black arrows). Regression analyses testing association of time with CoNTeXT scores are provided in Supplementary Table 4. (b) Module preservation analysis comparing co-expression network modules in vivo vs in vitro. Z-scores are plotted against the number of genes within each module. Highest significant preservation (Z-score) is observed for cell cycle-related (red, magenta) modules in both data sets using BDNF (Nishida and Chiocchetti). In our set-up, neuronal function modules such as ‘glutamatergic synaptic transmission, axon and dendrite development' (salmon, green) or ‘GABAergic synaptic transmission and synaptic vesicle exocytosis' (lightgreen) were nominally significant, whereas ‘axon guidance, neuronal migration and GTPase activity' (purple) show intermediate (Z-score 2–10) preservation. No preservation was observed for modules related to synaptic transmission (pale-turquoise, yellow), gliogenesis (tan, yellow) or immune response (black, orange) in any data set. Dashed lines mark Z-scores blue=1.96, red=4, green=10. For details see Supplementary Table 4. (c) Mapping of transitions between stages and cortical layers is shown as rank–rank hypergeometric overlap (RRHO) maps. Genes were ranked based on signed P-values comparing undifferentiated versus differentiated cells. These ranks were binned (200 genes each) and respective genes were tested using a hypergeometric test for overlap with the genes in all bins generated of in vivo comparison of stages (x vs y axis) or cortical layers, respectively. P-values of each comparison are plotted. The coloring of −log10 (P-values) is scaled to the maximum values observed in the original publication by Stein et al.9 The maximum P-value within each analysis is shown as a measure for overall accuracy. Simulations performed by Stein et al.9 predict that given a –log10(P-value)~300 in the stage transition mapping the CoNTeXT algorithm can predict the developmental stage with an estimated accuracy ~96% and brain region accuracy ~90%. For details see original publication.9 AMY, amygdala; CBC, cerebellar cortex; HIP, hippocampus; STR, striatum; THAL, thalamus.

