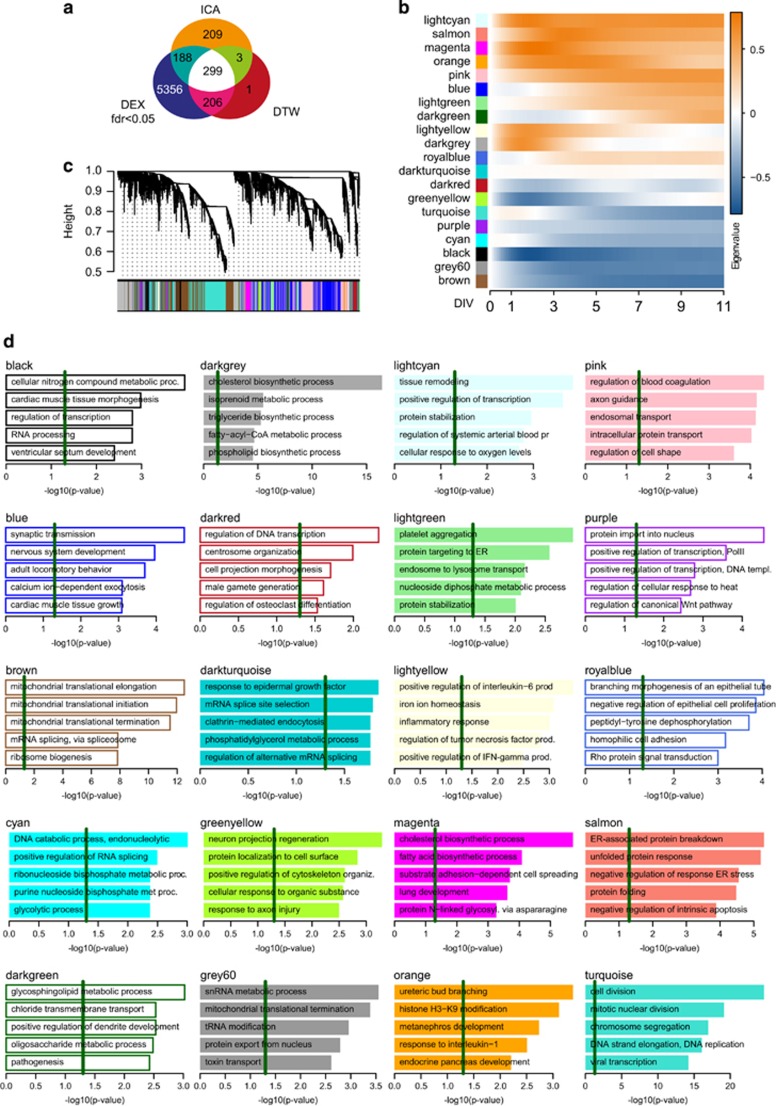
Figure 4.
Overlap of results and weighted gene co-expression network analysis. (a) Overlap of gene sets identified through linear regression (false discovery rate (FDR)<0.05; Figure 2a) DEX, dynamic time warping analysis (DTW; Figure 2c) and parallel independent component analysis (pICA; Figure 3). (b) Weighted gene co-expression network analysis (WGCNA) module definition based on topological overlap; colors correspond to modules identified. (c) Module Eigenvalues (that is, first principal component; Eigengene) of log2 fold changes of the respective modules normalised to time point 0 DIV. (d) GO-term enrichment analysis of identified network modules. Weighted P-values of the five most significant terms are shown. Green line marks the weighted P<0.05 cutoff.

