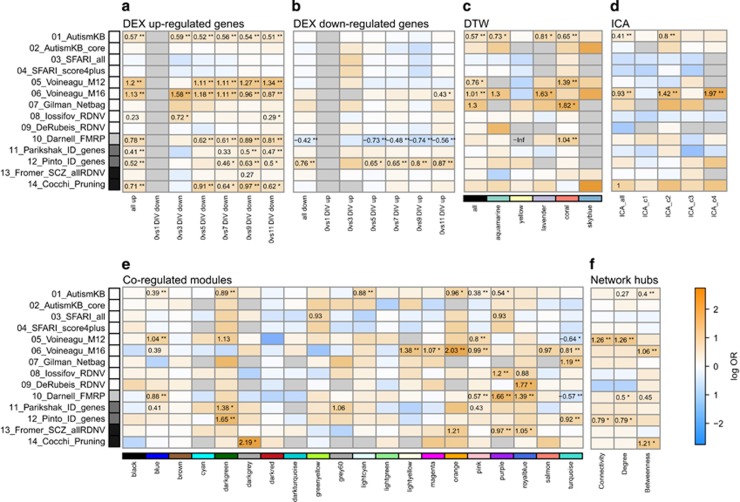
Figure 5.
Risk gene enrichment analysis. Disorder-implicated risk-gene lists were tested for enrichment in (a) up-regulated differentially expressed genes (DEX), (b) down-regulated DEX genes (no gene survived correction for multiple testing comparing time point 1 DIV; thus, enrichment testing was not applicable), (c) genes dynamically regulated (dynamic time warp (DTW)), (d) genes contributing to biological regulatory components (ICA); e) modules identified by the weighted gene co-expression network analysis (WGCNA) and (f) the top 10% of genes based on Connectivity, Degree and Betweenness. Connectivity is the sum of all adjacencies for a given gene. Degree is defined as the number of connections and Betweenness centrality is the number of shortest paths in a network passing through a given gene. For details on the tested gene lists, see Materials and Methods section. Log-transformed odds ratios are shown if the respective false discovery rate (FDR)<0.1. Asterisks mark significance: *FDR<0.05; **FDR<0.01. Shaded boxes on the left of heatmaps correspond to genes implicated in autism spectrum disorder (ASD; white), fragile X syndrome (FXS; light grey), intellectual disabilities (ID; dark grey) and schizophrenia (SCZ; black).

