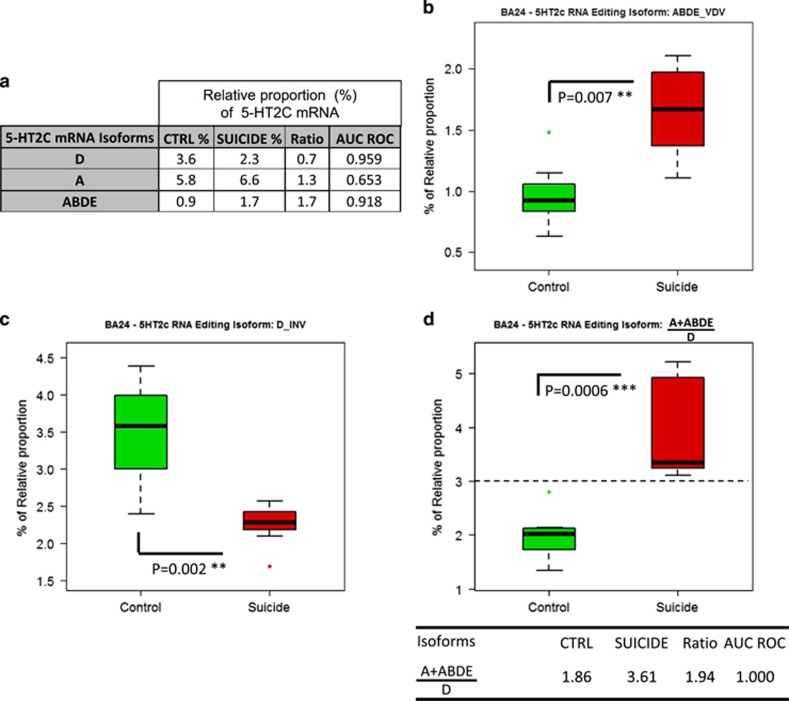
Figure 5.
Suicide-induced alterations of the relative proportion of 5-HT2CR isoforms in BA24. (a) Table showing the most significant changes of the relative proportion of 5-HT2CR mRNA isoforms in BA24 of the suicide group (see Figure 4a). (b, c) Comparison of the relative proportion of ABDE and D isoforms in control (n=7) and suicide groups (n=7). Boxplot represents ln(x) of the relative proportion of 5-HT2CR mRNA in BA24 of both groups and s.e.m. (d) Sum of the relative proportion (%) of the non-edited (NE), A and ACD 5-HT2CR isoforms in control and suicide groups. **P⩽0.01 and ***P⩽0.001.

