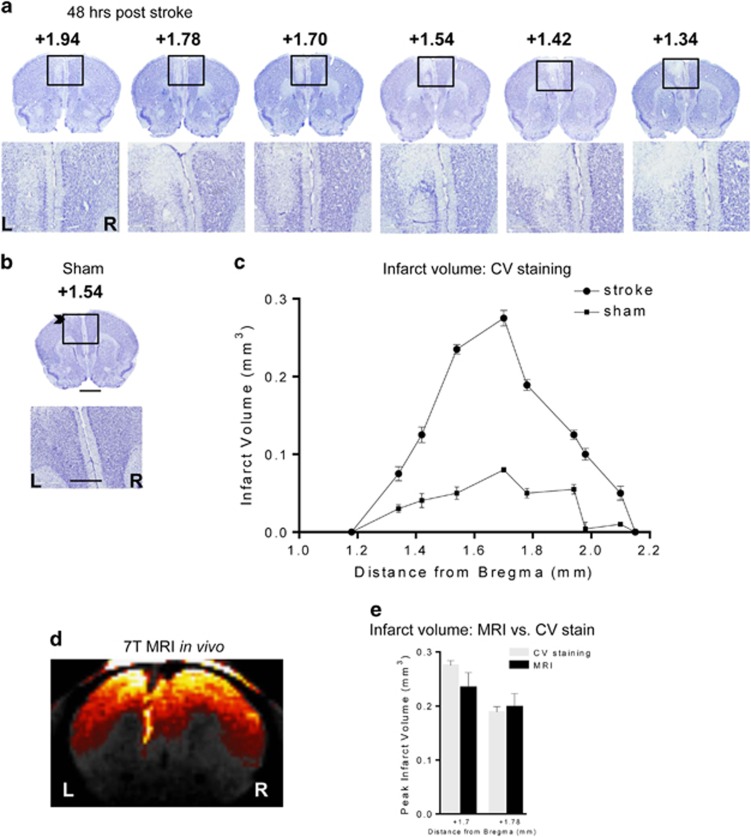
Figure 1.
Lesion location following ET-1 injection into left mPFC. (a) Representative microphotographs of CV-stained brain sections from a representative ET-1-injected mouse showing cell loss at 48 h post surgery shown at low (× 3.5) and high (× 20) magnification of the lesion site (box) with bregma locations indicated above. Scale bar, 400 and 50 μm. (b) A representative microphotograph of a CV-stained section of a sham control showing a trace of the needle track (arrowhead) detectable on left (L) side compared with the right (R) at 3.5 × and 20 × magnification. Scale bar, 400 and 50 μm. (c) Quantification of ET-1-induced lesion volumes at 48 h post surgery through the longitudinal axis of the lesion according to bregma locations (sham, n=3; stroke, n=3). (d) ET-1 lesion site visualized in vivo by MRI. Shown is a representative 7 T MRI image done in an anaesthetized living mouse at 4 days post stroke showing a 300-μm MRI section in which the lesion site is visualized and limited to the left mPFC (left, L; right, R); n=4–5 per experimental group. (e) Comparison of lesion size in MRI versus CV staining. Images obtained from in vivo MRI scanning or post-mortem CV staining of the same mice were quantified at two different distances from Bregma. Infarct volumes showed low variability and did not differ between the two measures. n=4. CV, cresyl violet; ET-1, endothelin-1; mPFC, medial prefrontal cortex; MRI, magnetic resonance imaging.

