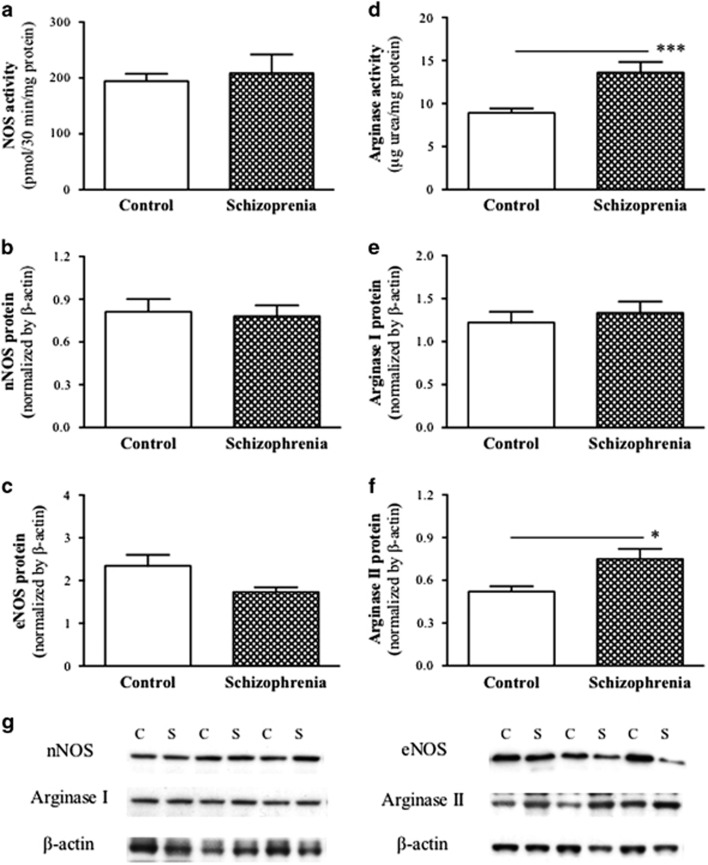
Figure 1.
Mean (±s.e.m.) total NOS (a) and arginase (d) activity, and protein levels of nNOS (b), eNOS (c), arginase I (e) and arginase II (f) in the frontal cortex (BA8) from non-psychiatric control and schizophrenia cases (n=20 per group). (g) Example of western blots showing nNOS, eNOS, arginase I and arginase II protein expression between the control (c) and schizophrenia (s) groups with their corresponding β-actin loading controls. Asterisks indicate significant differences between groups at *P<0.05 or ***P<0.001. BA8, Brodmann's area 8; eNOS, endothelial NOS; NOS, nitric oxide synthase; nNOS, neuronal NOS.

