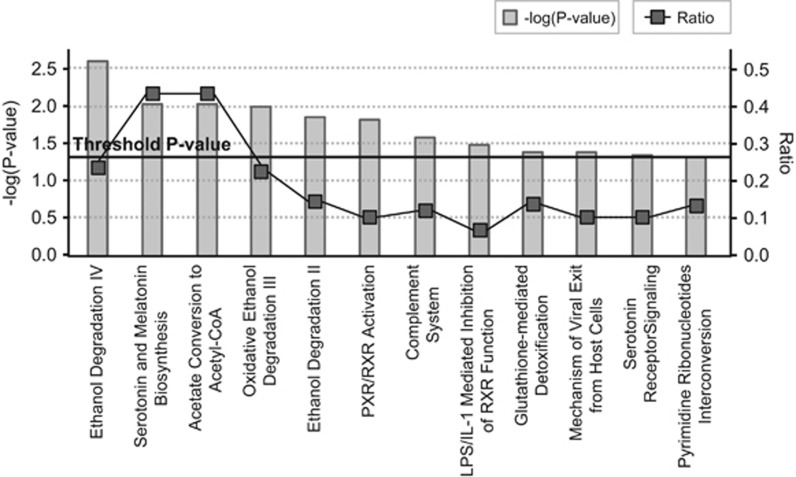
Figure 2.
Significantly enriched canonical pathways considering differentially expressed genes identified in the trans-eQTL analysis. Along the x axis of the bar chart, the canonical pathways are shown. Along the left y axis, the statistical significance is indicated as −log(P-value), calculated using the right-tailed Fisher's exact test. Gray bars denote statistical significance of the enrichment for each canonical pathway. The black straight line stands for the threshold above which there is significant enrichment (by default P-value <0.05). Along the right y axis, the ratio parameter is shown, calculated by the numbers of genes in a given pathway that meet cutoff criteria, divided by total numbers of genes that make up that pathway. Black squares express the ratio for each pathway. eQTL, expression quantitative trait locus.

