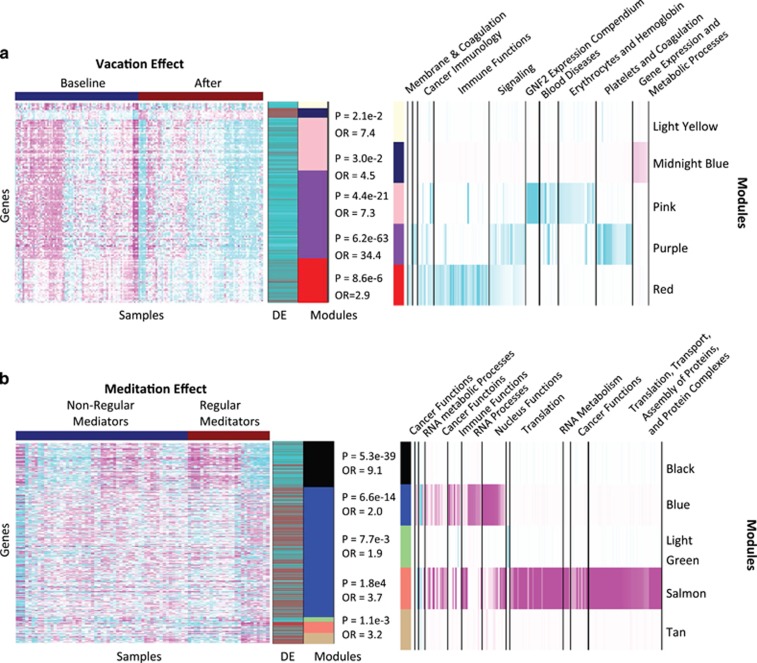
Figure 2.
Characterizing molecular changes in response to vacation and meditation. (a) Heatmap of the top differentially expressed genes between baseline and follow-up (‘vacation' effect) after two-way hierarchical clustering. The expression values depicted in the heatmap were converted to Z-scores and ordered in the sample and gene dimensions according to the dendograms produced by the clustering procedure. Cyan (magenta) indicates genes that are down- (up) regulated at the baseline time point relative to the follow-up time point, with the intensity indicating the significance of the Z-score. The color band to the right of the heatmap indicates the mean difference in expression (DE) between the baseline and post-intervention time points for each of the differentially expressed genes. Red (cyan) indicates down- (up) regulation at the post-intervention time point compared with baseline. The module colors indicate the coexpression modules to which the genes belong, with the odds ratio and P-value given for each module reflecting the overall enrichment for differentially regulated genes in the module. The pathway enrichment heatmap indicates the –log10 of the P-value for pathways enriched in the indicated coexpression module. Brighter cyan (magenta) indicates larger –log10 P-values for pathways that are down- (up) regulated. (b) Similar to a but with genes differentially expressed between regular meditators with novices and the vacation group at the follow-up time point.

