Figure 1.
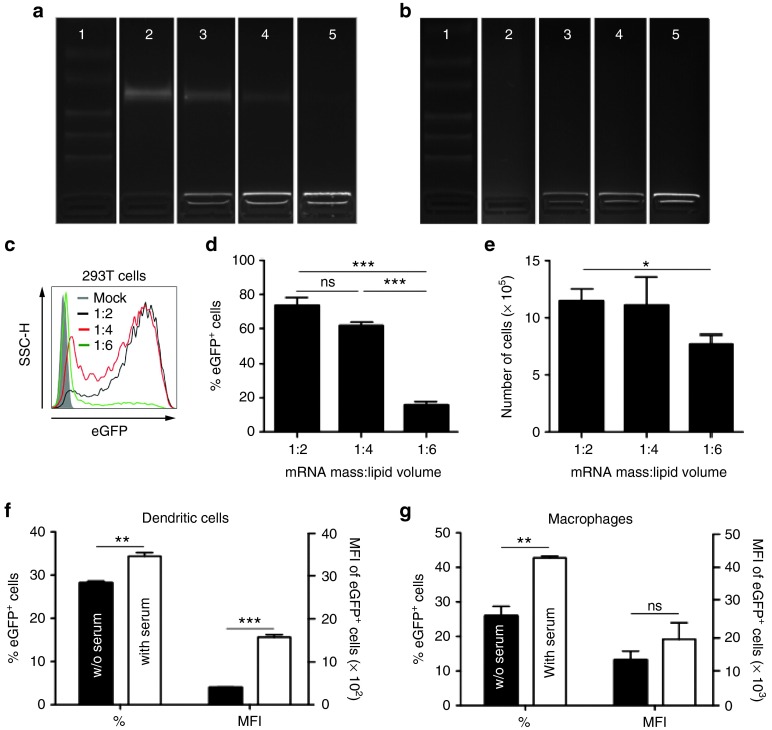
Efficient in vitro transfection of dendritic cells (DCs) and macrophages with lipid mRNA particles (LMPs). (a,b) Electric mobility shift assay of mRNA packaged at different mRNA:lipid ratios. mRNA formulated in 0.8 lactated Ringer's solution served as a control. In a the samples were not exposed to serum, whereas in b the samples were incubated with 10% fetal clone I serum for 30 minutes. The photographs show representative pictures of the three independent experiments. Lanes 1 to 5 represent: (1) ladder; (2) mRNA in 0.8 lactated Ringer's solution; LMPs at a 1:2 (ref. 25); (4) 1:4, and (5) 1:6 ratio. (c) Representative histogram of 5 × 10⁵ human embryonal kidney 293T cells transfected with 2.5 µg enhanced green fluorescent protein (eGFP) mRNA packaged at different mRNA:lipid ratios. Transfection was performed in OptiMem. Twenty-four hours later, cells were harvested, counted by trypan blue staining to determine the percentage of live/dead cells, and evaluated in flow cytometry for the expression of eGFP. The graph in d depicts the percentage of eGFP+ cells after transfection (n = 5). The graph in e depicts the cell viability after transfection (n = 5). (f) Five hundred thousand DCs were transfected with 2.5 µg eGFP mRNA, complexed at a 1:2 mRNA:lipid ratio in the absence or presence of serum. The graph depicts the percentage and the mean fluorescence intensity (MFI) of eGFP+ cells (n = 3). (g) Five hundred thousand RAW246.7 macrophages were transfected with 2.5 µg eGFP mRNA complexed at a 1:2 mRNA:lipid ratio in the absence or presence of serum. Twenty-four hours later, cells were harvested and evaluated in flow cytometry for the expression of eGFP. The graph depicts the percentage and the MFI of eGFP+ cells (n = 4). The graphs in d–g summarize the results of the indicated number of experiments as mean ± SEM. ns, not significant.

