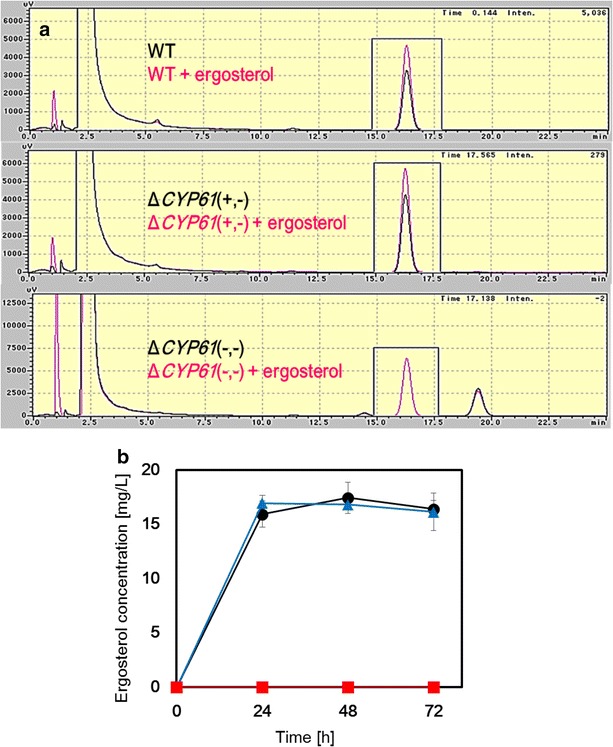
Fig. 4.

Ergosterol biosynthesis. a RP-HPLC ergosterol analysis from the parental host strain, ΔCYP61(+, −) and ΔCYP61(−, −). Chromatograms (at 280 nm) correspond to ergosterol extracted from strains as described in the “Methods” section. Ergosterol extracts (black) from the parental host strain, ΔCYP61(+, −) strain and ΔCYP61(−, −) strain were analyzed with co-injection of ergosterol standard (pink). b Ergosterol production in the parental host strain, ΔCYP61(+, −) strain and ΔCYP61(−, −) strain. Circle (black), triangle (blue) and square (red) symbols represent values of the parental host strain, ΔCYP61(+, −) strain and ΔCYP61(−, −) strain, respectively. The values are means and the error bars show the standard deviation (n = 3)
