
Fig. 5.
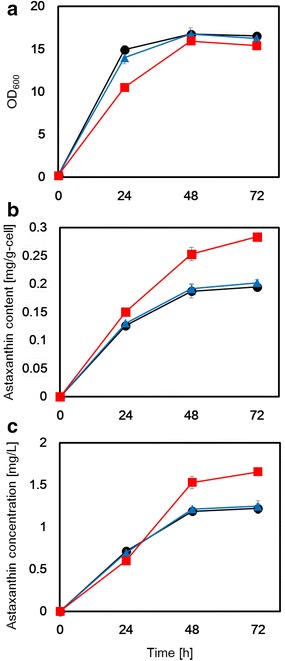
RP-HPLC ergosterol analysis from the parental host strain, ΔCYP61(+, −) strain and ΔCYP61(−, −) strain respectively, and astaxanthin production in each. a Cell concentration (OD600); b intracellular astaxanthin content (mg/g-cell). c volumetric astaxanthin concentration (mg/L). Circle (black), triangle (blue) and square (red) symbols represent values of the parental host strain, ΔCYP61(+, −) strain and ΔCYP61(−, −) strain, respectively