Fig. 1.

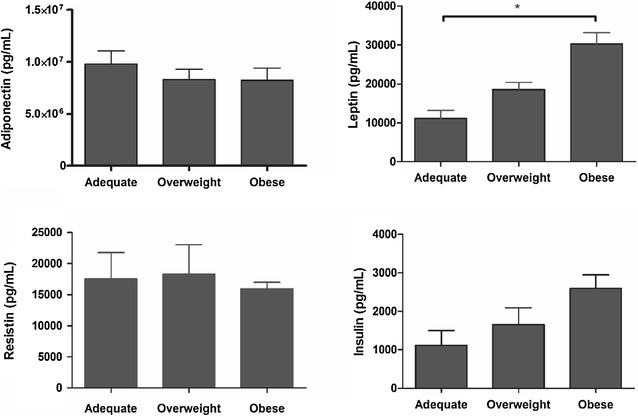
Adiponectin, leptin, resistin and insulin levels according to weight classes of the pregnant women. (Values as mean ± standard error of the mean; *p < 0.05—ANOVA, followed by the Tukey–Kramer test)

Adiponectin, leptin, resistin and insulin levels according to weight classes of the pregnant women. (Values as mean ± standard error of the mean; *p < 0.05—ANOVA, followed by the Tukey–Kramer test)