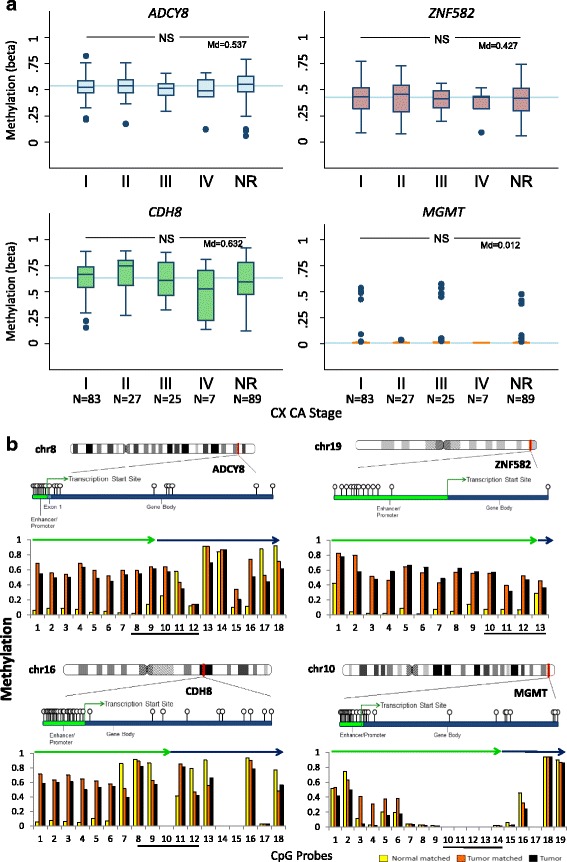
Fig. 4.

Promoter methylation of ADCY8, CDH8, ZNF582, and MGMT in the TCGA cervical cancer cohort. a Box plots of CpG methylation (β value) according to FIGO stage for 231 patient samples with squamous cell carcinoma. Gene-specific median methylation values for all FIGO stages are specified (Md) and indicated by the blue reference lines. NS not statistically significant, Kruskal-Wallis P > 0.05. NR stage not reported. b Differential CpG methylation (β value) ante- and post-transcription start site for 257 cervical carcinomas (squamous, N = 231; adenocarcinoma, N = 26) and 3 tumor/matched normal samples. The four panels display the chromosomal positions of ADCY8, CDH8, ZNF582, and MGMT (red line) with an expanded area showing the CpG probes on the Illumina HumanMethylation 450 K microarray (gene ball-and-stick diagrams). The bar graphs present the median DNA methylation (β value) of 257 tumors (black) and 3 matched tumor (orange)/normal (yellow) samples across the ordered CpG probes. The promoter methylation levels were notably higher (~×10) for tumor (median β ~0.6) than the normal samples (median β ~0.06) for ADCY8, CDH8, and ZNF582. The enhancer/promoter and gene body regions are indicated by the green and blue arrows, respectively. The CpG regions selected for bisulfite pyrosequencing of cytology samples are denoted by the underscored CpG probes. The chromosome coordinates for the CpG probes along the X-axis are as follows: ADCY8 (chr8: 132,053,823-131,896,788), CDH8 (chr16: 62,070,072-61,871,849), ZNF582 (chr19: 56,905,383-56,901,457), and MGMT (chr10: 131,264,840-131,304,833). [Chromosome ideograms adapted from NCBI Map Viewer (www.ncbi.nlm.nih.gov/genome/guide/human)]
