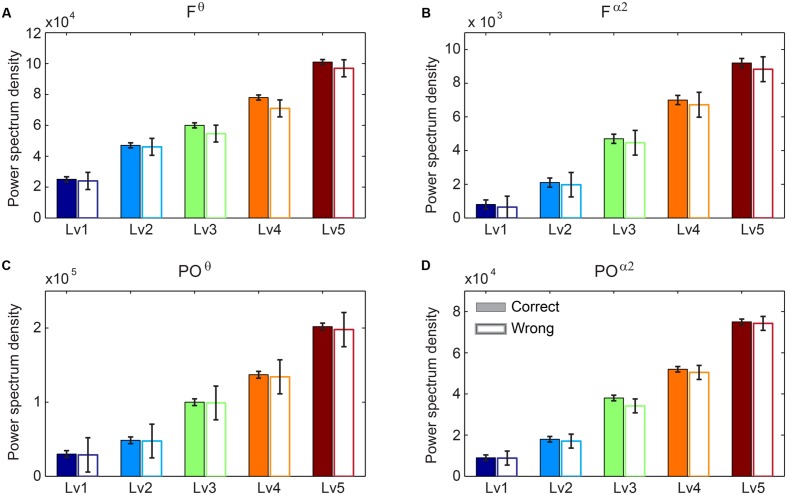
FIGURE 3.
Group-averaged power spectrum in θ band (5–6 Hz) (A) over frontal (F) bilaterally areas and (C) over parieto-occipital (PO) sites and in α2 band (10–13 Hz) (B) over F bilaterally areas and (D) over PO sites for the five CWLs in both correct and wrong trials. Bars represent mean ± standard error of mean (SEM). No statistical significant differences were detected based on Wilcoxon rank sum test (p < 0.001; Bonferroni corrected across CWLs).

