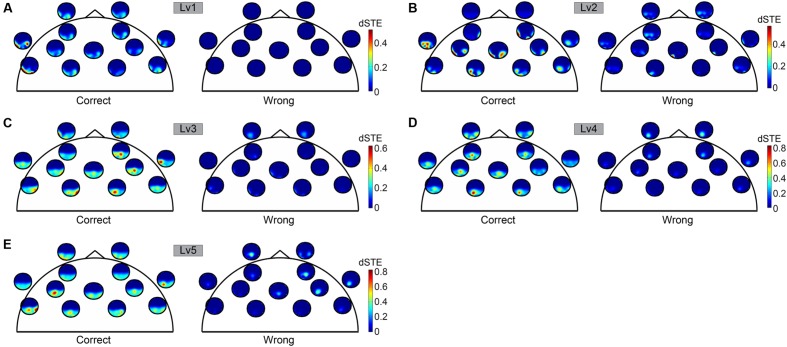
FIGURE 6.
To represent dSTE for each of the five cognitive workload levels [(A) Lv1, (B) Lv2, (C) Lv3, (D) Lv4, and (E) Lv5] and in both correct (left panel) and wrong trials (right panel), we adopted a novel visualization scheme, in which the relative position of a single sensor u is used to embed a whole brain’s topography that represents the dSTE(u,v) measurements related to it. A minute topography depicts the dSTEs from a particular sensor to all other destinations (sensor locations). It serves as a natural display of a row in the dSTE matrix. The topographic representation illustrates only the Frontal sensors because ΔdSTE uncovered Fθ brain region as a leader.

