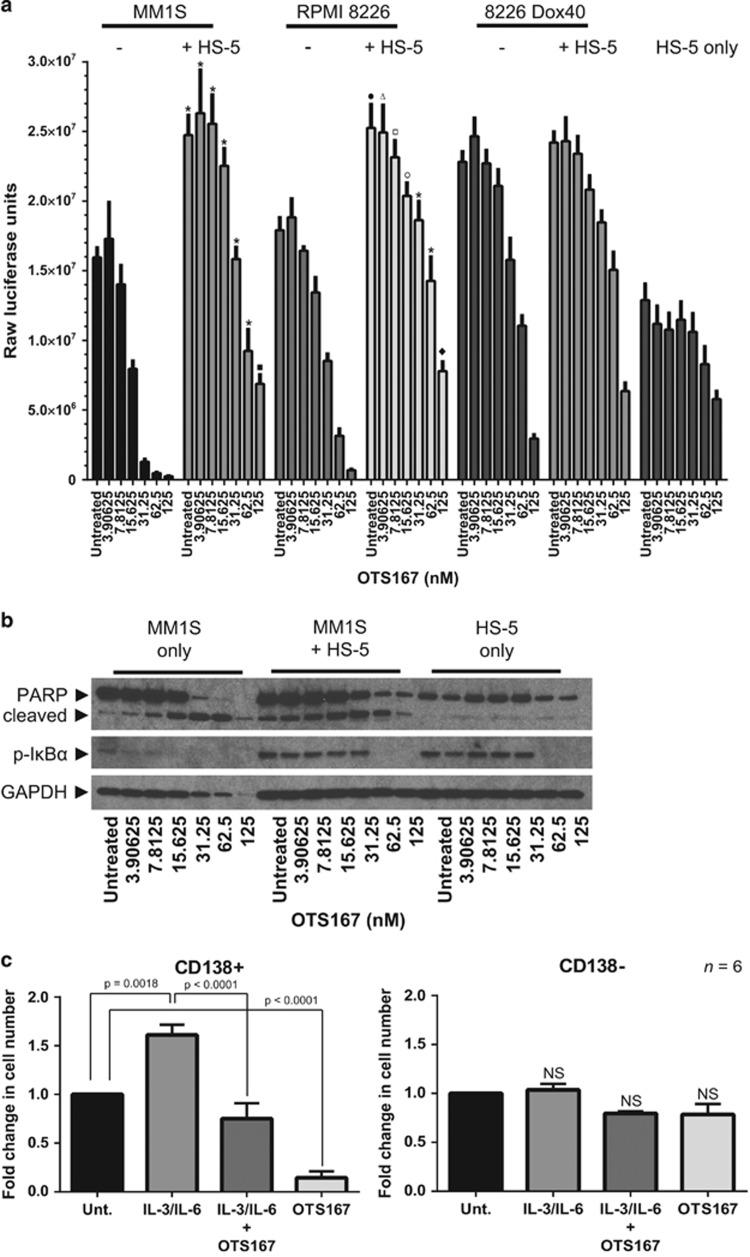
Figure 2.
MELK inhibition overcomes drug resistance in the recapitulated bone marrow microenvironment and impairs putative myeloma stem cell repopulation of malignant MM PC. (a) The indicated cell lines were cultured alone or together as indicated and treated with OTS167 in increasing concentrations for 48 h before measuring metabolically active cell numbers using the CellTiter-Glo Luminescent Cell Viability Assay on a Glomax 96 microplate luminometer (Promega, Madison, WI, USA). Statistical significance of differences (set at P<0.05) was determined using two-way analysis of variance with Tukey's multiple comparison test in GraphPad Prism 6 (GraphPad Software, La Jolla, CA, USA). Adjusted P-values are indicated. Raw luciferase units are reported. Results shown are of two experiments performed in triplicate. *P<0.0001; ▪P=0.0063; •P=0.0015; ΔP=0.0167; □P=0.0053; ○P=0.0035; ♦ P=0.0024. (b) Western blot analysis of MM1S and HS-5 stromal cells cultured alone or together with increasing concentrations of OTS167 for 48 hours demonstrates preferential apoptosis in myeloma cells. (c) Peripheral blood mononuclear cells (PBMC) were obtained by Ficoll gradient separation and 2.0–2.5 × 10⁶ PBMC/well in six-well plates were cultured as indicated with recombinant human interleukin-3 (IL-3) and IL-6 (both at 5 ng/ml), purchased from R&D Systems (Minneapolis, MN, USA) (catalog number 203-IL and 206-IL, respectively), or OTS167 (10 nm) alone or in combination for 6 days. Cultures were collected and subjected to immunomagnetic positive selection to separate CD138+ plasma cells from CD138− cells. Trypan blue-negative cells were counted and the fold change in each population in response to each treatment is depicted. Data represent six independent determinations from six separate blood samples from MM patients. Statistical significance of differences (set at P<0.05) was determined using one-way analysis of variance with Tukey's multiple comparison test in GraphPad Prism 6 (GraphPad Software). P-values are indicated. Effects on CD138− populations are not significant (NS).

