
Fig. 1.
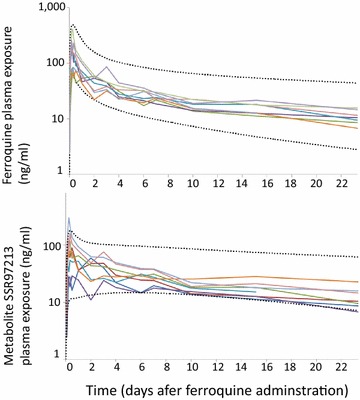
Time course of individual ferroquine and SSR92713 exposure following oral administration of 800 mg ferroquine. Predicted data were presented as the 2.5th and 97.5th confidence intervals using Berkeley Madonna denoted by the black dashed time courses. The model (1000 simulations) used an adjusted first order input