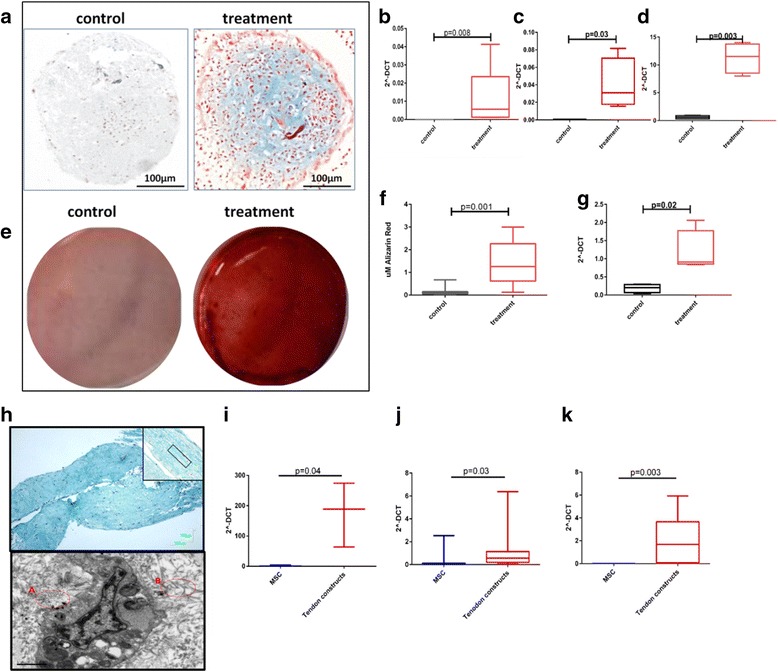
Fig. 1.

Histochemical and gene expression analysis of chondrogenic, osteogenic and tenogenic lineage differentiation for MSCs. Images are representative of all experiments. a MSC pellets cultured in control or chondrogenic media were fixed and stained with Alcian Blue (scale bar = 100 μm). Gene expression of b aggrecan, c COL2A1 and d SOX9 following chondrogenic differentiation. Statistical evaluation was undertaken using Mann–Whitney U test (n = 6). e Osteogenic differentiation from MSCs was confirmed with Alizarin Red S staining at day 21 to visualise mineralised bone matrix following extraction of the calcified mineral from the stained monolayer at low pH. f Box and whisker plot showing quantitative results of Alizarin red staining. Statistical significance, Mann–Whitney U test p < 0.001 (n = 12). g Gene expression of RUNX2 following osteogenesis. h Histology images of a tendon construct made from MSCs stained with Masson’s Trichrome to identify collagenous matrix. Image was captured at ×4 magnification and ×10 magnification (inset, upper image) (scale bar = 100 μm). Example of more organised areas of collagen is marked on the inset image (red). (Lower image) Ultrastructural analysis using scanning TEM. Presence of aligned extracellular collagen fibrils (A) and less organised collagen (B) are inset (red) (scale bar = 1 μm). Tenogenic differentiation was also evaluated using gene expression of i COL1A1, j SERPINF1 and k THBS4. For gene expression, data are represented as 2–ΔCT compared with GAPDH. Statistical evaluation was undertaken using Mann–Whitney U test (n = 8) with data represented as 2–ΔCT compared with GAPDH. MSC mesenchymal stem cell
