Fig. 2.

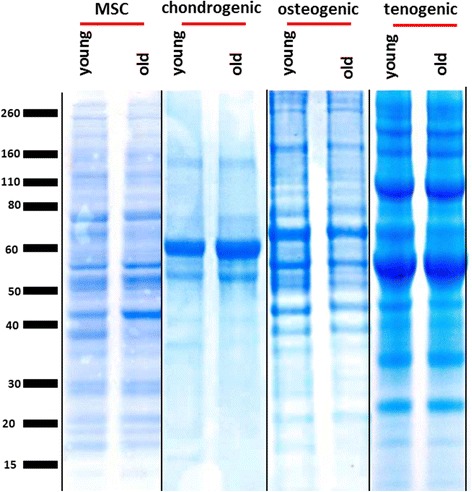
Coomassie-stained one-dimensional SDS-PAGE of the guanidine-soluble protein extracts of chrondrogenic and osteogenic constructs and Rapigest™ extracts of tenogenic constructs compared with Rapigest™ extract of MSCs. Images are representative of all experiments. Equal protein loading by weight (30 μg per well) allowed a qualitative and grossly quantitative comparison of soluble protein extracts. Vertical black line indicates independent gels. Lines indicate digital splicing. MSC mesenchymal stem cell
