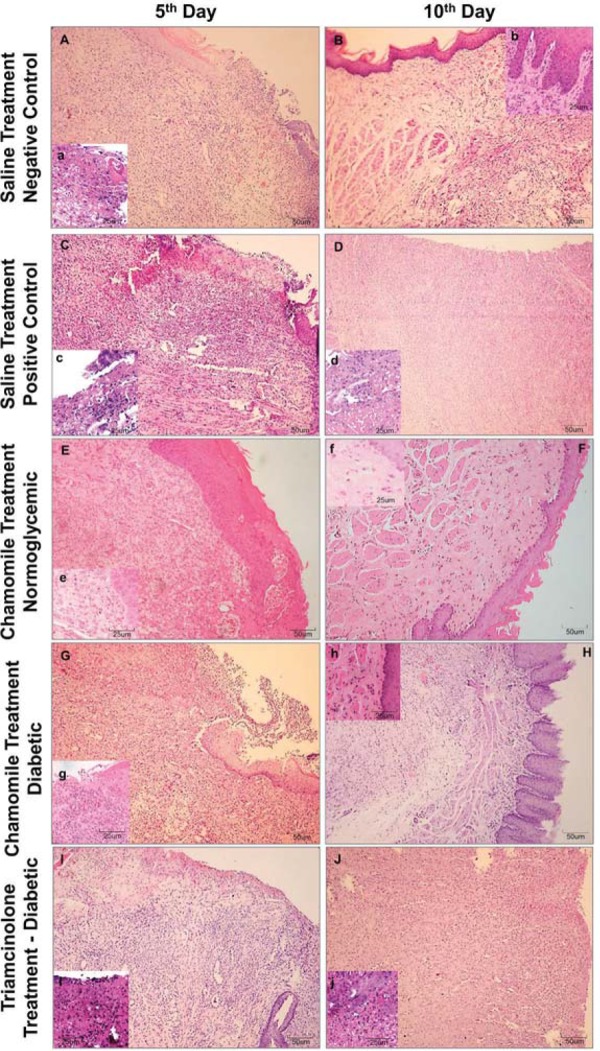
Figure 3. Photomicrograph of ulceration in the buccal mucosa in the Saline Treatment groups [Negative Control=Normoglycemic Rats (A and B); Positive Control Group=Diabetic Rats (C and D)], Chamomile Treatment Groups [Normoglycemic (E and F) and Diabetic Rats (G and H)], and Triamcinolone Group (I and J), respectively. (Hematoxylin & eosin, Capital letters=100x; Small letters=200x).

