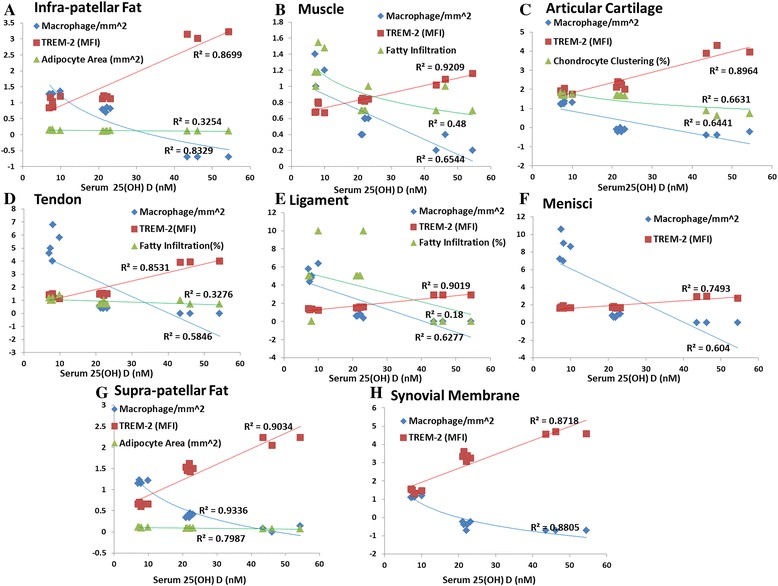
Fig. 3.

Analysis of changes in inflammation, fatty infiltration, adipocyte area, and chondrocyte clustering by vitamin D status in knee joint tissues. a Macrophage density (per square millimeter, logarithm values), triggering receptor expressed on myeloid cells (TREM)-2 mean fluorescence intensity (MFI), and adipocyte area (per square millimeter) in infrapatellar fat. b Macrophage density (per square millimeter), TREM-2 MFI, and fatty infiltration (percentage of area, logarithm values) in muscle. c Macrophage density (per square millimeter, logarithm values), TREM-2 MFI, and chondrocyte clustering (clustered/total chondrocytes, logarithm values) in articular cartilage. d Macrophage density (per square millimeter), TREM-2 MFI, and fatty infiltration (percentage of area, logarithm values) in tendon. e Macrophage density (per square millimeter), TREM-2 MFI, and fatty infiltration (percentage of area) in ligament. f Macrophage density (per square millimeter) and TREM-2 MFI in menisci. g Macrophage density (per square millimeter, logarithm values), TREM-2 MFI, and adipocyte area (per square millimeter) in suprapatellar fat. h Macrophage density (per square millimeter, logarithm values) and TREM-2 MFI in synovial membrane
