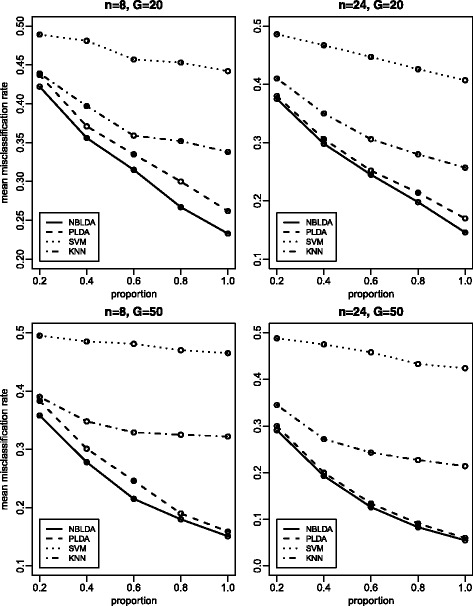
Fig. 2.

Mean misclassification rates for all four methods with ϕ=20 and σ=5. The x-axis represents the proportion of differentially expressed genes. 20, 40, 60, 80 and 100 % differentially expressed genes are considered, respectively. These plots investigate the effect of proportion of differentially expressed genes
