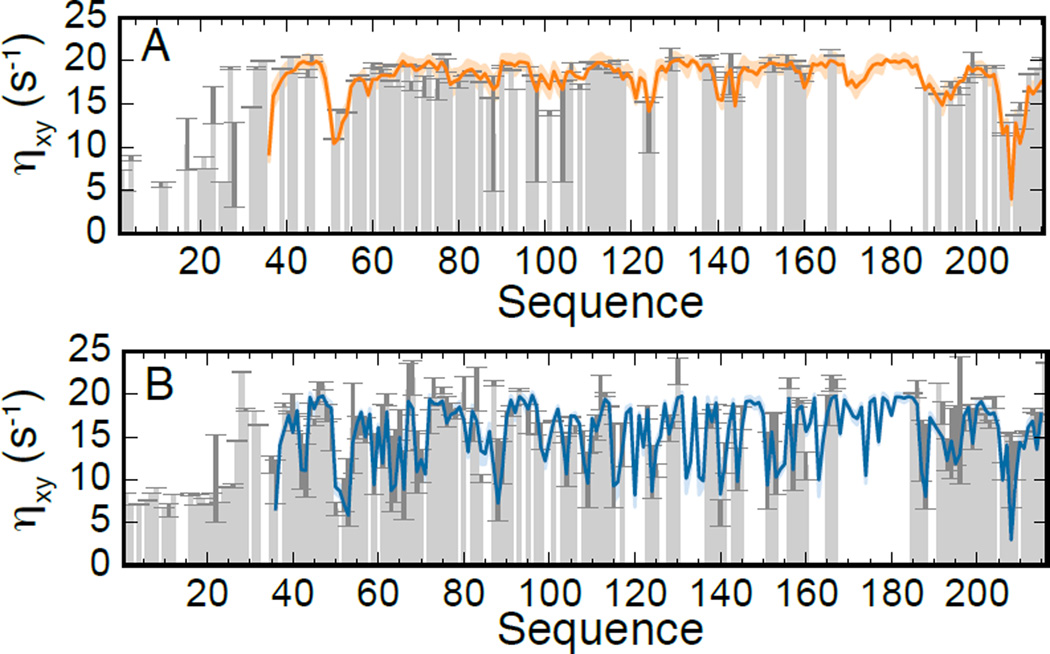
Figure 1.
CSA/DD cross-correlated cross-relaxation transverse rates (ηxy). Experimental values (grey bars) for the GB1-eIF4E construct before (panel A) and after (panel B) adding 4EGI-1 (200 µM, corresponding to 2× the protein concentration) are reproduced by linear combinations of the values derived from simulations 1 and 2 as described in the text. Pearson correlation coefficient and p-value are 0.80 and 3.44·10−21, and 0.89 and 9.02·10−40 for panel A and B, respectively. Only data on the eI4E chain are shown.

