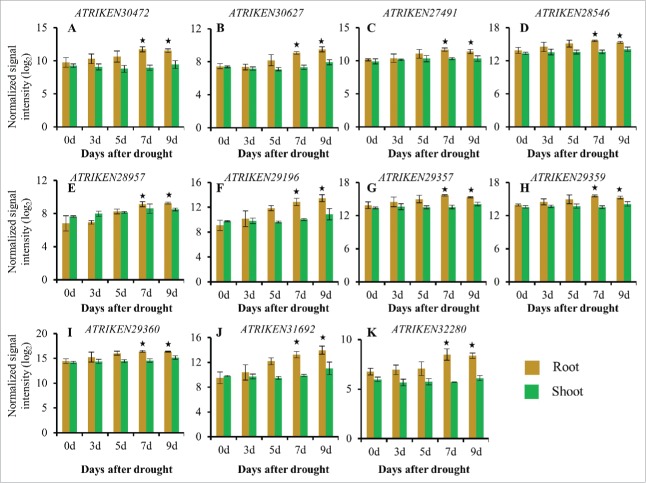
Figure 3.
sORFs upregulated specifically in roots in response to a progressive drought stress treatment. Normalized log2 values were used to plot the expression of sORFs up-regulated specifically in roots in response to a progressive drought stress treatment. (A): ATRIKEN30472, (B): ATRIKEN30627, (C): ATRIKEN27491, (D): ATRIKEN28546, (E): ATRIKEN28957, (F): ATRIKEN29196, (G): ATRIKEN29357, (H): ATRIKEN29359, (I): ATRIKEN29360, (J): ATRIKEN31692, (K): ATRIKEN32280. Data presented are the mean ± sd, n = 3. Bars with an asterisk above are significantly different from Day 0 based on a q value <0.01, fold change ≥2.

