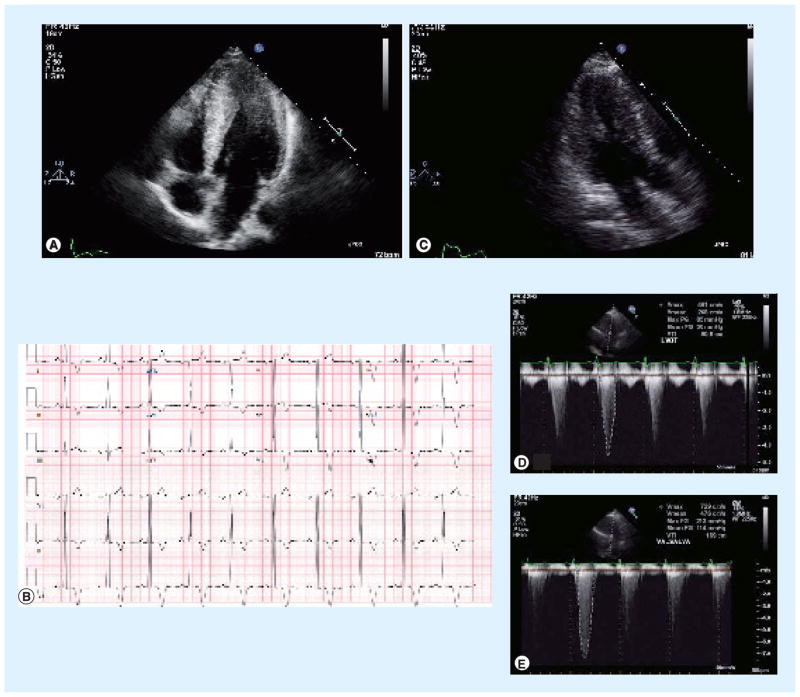
Figure 3. Hypertrophic cardiomyopathy (HCM).
(A) Transthoracic echocardiogram in the apical four-chamber view demonstrates pronounced thickening of the distal interventricular septum and lateral wall of the left ventricle, consistent with the apical variant of HCM. (B) 12-lead electrocardiogram with evidence of left ventricular hypertrophy and deep T-wave inversions throughout the precordium, characteristic of apical variant HCM. (C) Transthoracic echocardiogram in the apical long-axis view demonstrates left ventricular hypertrophy, most pronounced in the interventricular septum, consistent with HCM. (D) Transthoracic echocardiogram using Doppler signal in the left ventricular outflow tract reveals a resting pressure gradient of 85 mmHg between the cavity of the left ventricle and the aortic root. (E) This pressure gradient augments to 213 mmHg with Valsalva maneuver, characteristic of the dynamic left ventricular outflow tract gradient of obstructive HCM.

