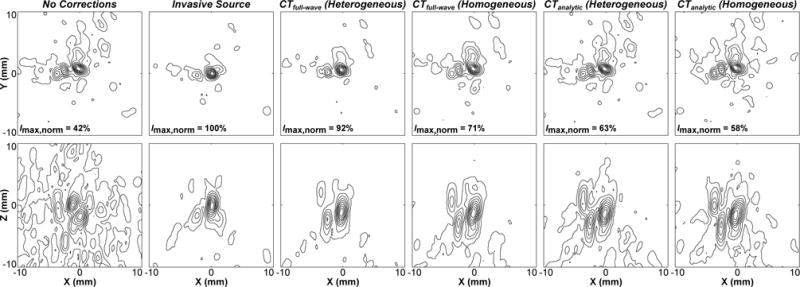
Figure 3.

Contour images of the fixed source emitter located at the array’s geometric focus, reconstructed through a human skullcap (Skull B) without corrections, with source- and various CT-based skull delay corrections. Lateral (top row) and axial (bottom row) maximum intensity projection images (2 cm stack) are shown. The peak intensity for each image is given normalized to the gold standard source-based correction case (Imax,norm). Linear contours are displayed at 10% intervals.
