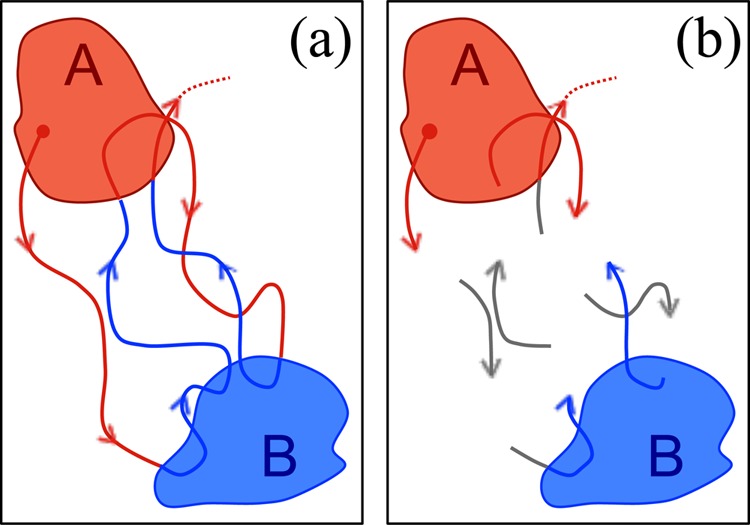
Figure 1.

Non-Markovian trajectory analysis with full and partial data. (a) Schematic representation of a single continuous trajectory where the color indicates the last state visited: blue trajectories were last in state B and red trajectories were last in A. (b) Multiple trajectory segments where color information is not always known, as indicated by gray and partially gray segments.
