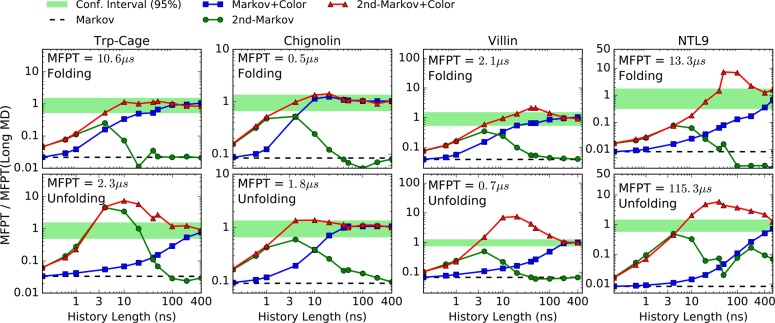
Figure 6.
MFPT estimates for protein folding (first row) and unfolding (second row) using RMSD-based states. MFPT values are normalized by reference values (shown with text) obtained from long MD simulations17 at the shortest lag time. The plots show the dependence of the various estimators on the history length used (see text). The green horizontal stripes are the 95% confidence interval for the reference values. Note that absolute MFPT values differ slightly from those in Figure 5; see text.

