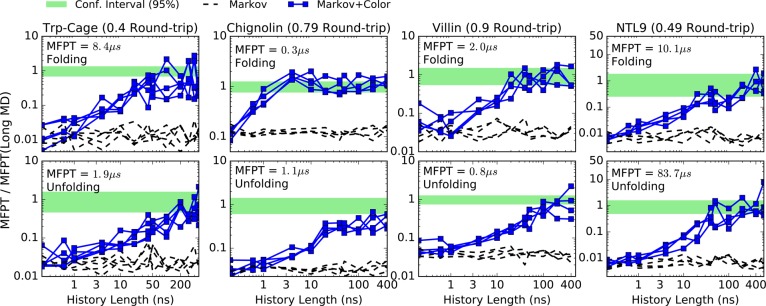
Figure 7.
Folding (first row) and unfolding (second row) MFPT estimates using MSM-optimized states. The estimations were done from subsamples that represent less than 5% of the available MD data17 for each protein at the shortest lag time. For each value of history length, four independent subsamples were extracted with replacement. A pair of folding and unfolding MFPT curves is generated using a total amount of trajectory data less than the round-trip time (sum of forward and backward MFPTs), as indicated for each protein.

