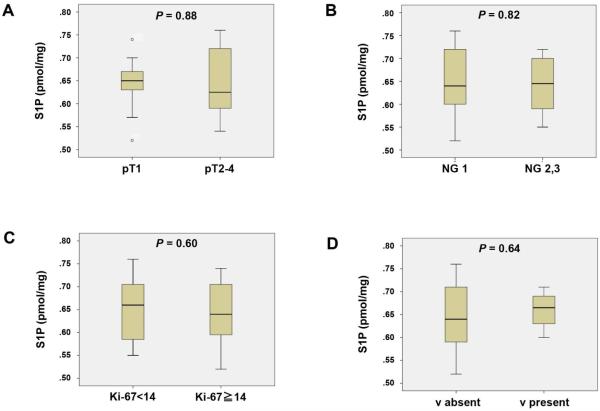
Fig. 5.
Levels of S1P in breast cancer tissue compared with pathological primary tumor (pT), nuclear grade (NG), the Ki-67 index and vascular invasion (v). The levels of S1P were determined in patients with pT1 or pT2-4 (A), NG 1 or NG 2, 3 (B), Ki-67 index < 14 or Ki-67 index ≧ 14 (C), and v absent or v present (D). Mean values are shown by horizontal lines. The statistical analysis was done by the Mann-Whitney U test.

