
Figure 2. CMC definition.
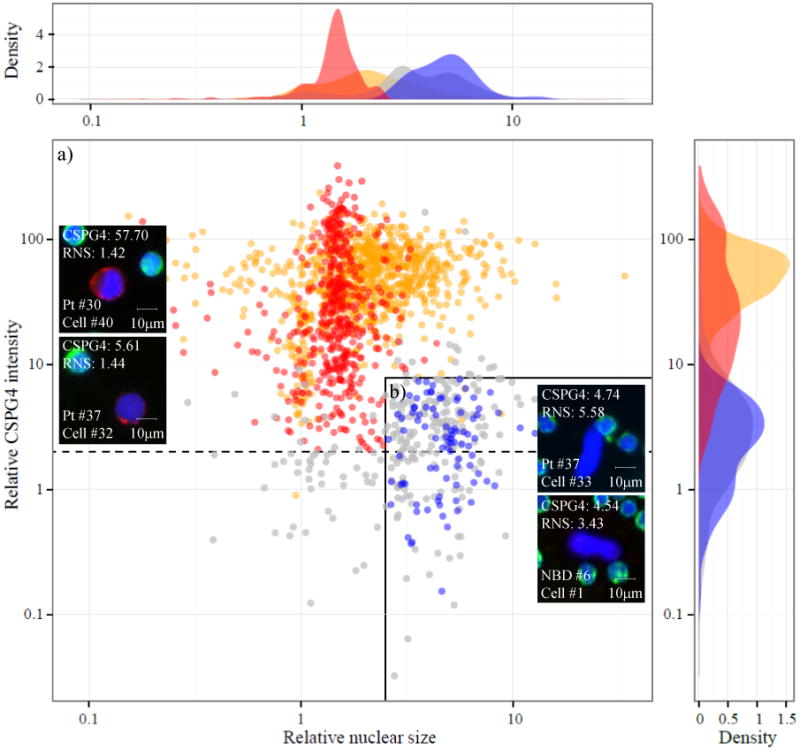
Scatter plot of candidate 1740 cells from 10 NBDs (blue; 105 cells), 40 melanoma patients (red; 741 cells) and 3 melanoma cell lines (orange; 894 cells) classified by relative CSPG4 protein expression and RNS. This parameter is calculated as the ratio of nuclear size of a candidate cell (in pixels) and the mean nuclear size of surrounding PBMCs. Excluded candidate cells from melanoma patients are represented in grey. This group includes cells with a relative CSPG4 signal <2, cells with a relative CSPG4 signal between 2-8 and a RNS larger than 2.5 and cells excluded by clinical pathologist. Dashed line indicates the cutoff value of 2 for relative CSPG4 intensity. Solid line delimits cells with a relative CSPG4 signal below 8 and RNS higher than 2.5. Both measurements are normalized against the values obtained in surrounding PBMCs. Representative merged color images of two CMCs (left), one ‘excluded candidate’ cell (top right) and one NBD cell. RNS: relative nuclear size; NBD: normal blood donor.