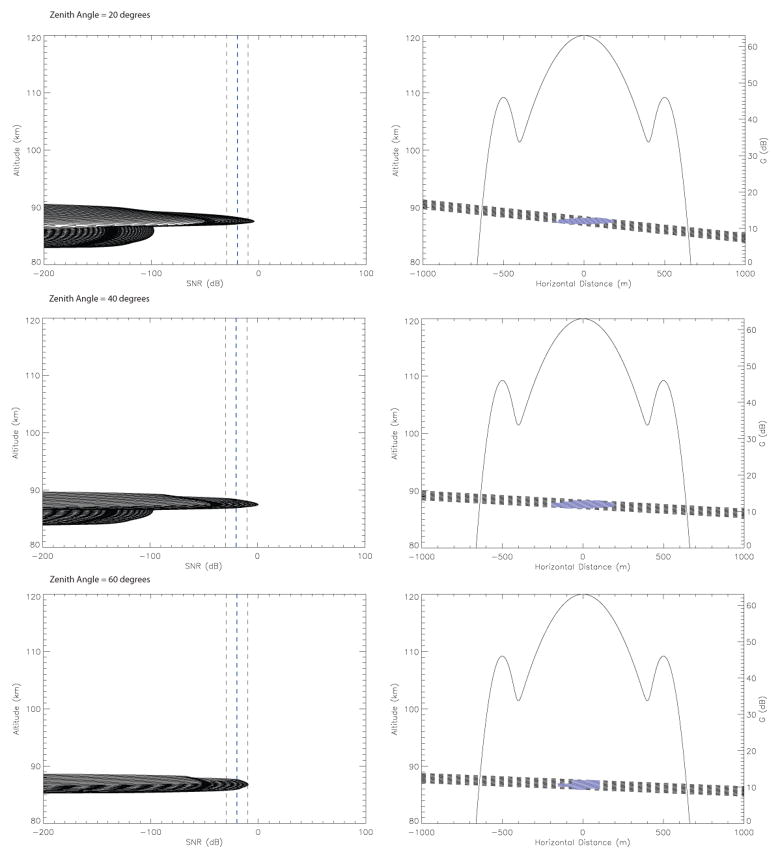
Fig. 5.
Results for the case of a 10 μg object with a speed of 11 km/sec for three different entry angles. Left panels: Meteor SNR as a function of altitude for all BEP for which the meteor calculated SNR was above −20 dB at some point during its trajectory. The vertical lines in these panels represent −30, −20 and −10 dB SNR. Right Panels: Trajectories (traveled altitude vs traveled horizontal distance; dash lines) of those meteors for which their SNR exceeded −20 dB at some point during their ablation profile. The solid blue dark portion of the trajectories, represents the section during which the SNR was greater than −20 dB. Also plotted on these panels is G in dB (right vertical axis) to provide an indication of where in the radar beam, these meteors become detectable. Each row represent a particular zenith entry angle and the trajectories are assume to cross the radar beam center.

