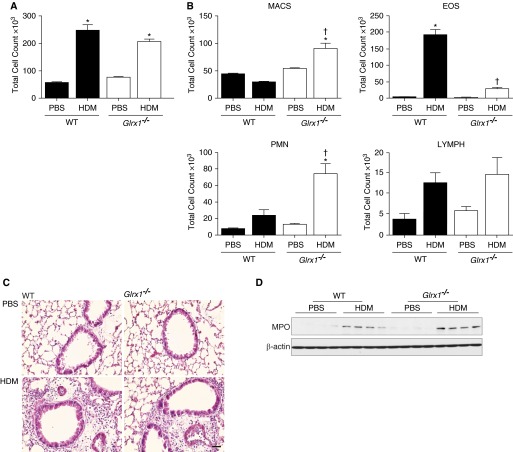
Figure 2.
Evaluation of airway and tissue inflammation in WT and Glrx1−/− mice after 15 challenges of HDM. (A) Total and (B) differential cell counts in bronchoalveolar lavage from WT and Glrx1−/− mice after exposure to PBS or HDM. Total cell numbers were determined by Advia, and data are expressed as means (± SEM) (eight or nine mice per group). *P < 0.05 (ANOVA) compared with PBS controls; †P < 0.05 (ANOVA) compared with WT mice challenged with HDM. (C) Histopathological evaluation of tissue inflammation via hematoxylin and eosin staining from PBS- or HDM-exposed mice (scale bar, 50 μm). (D) Immunoblot for myeloperoxidase in homogenized lung tissue. β-Actin is shown as a loading control. Immunoblots are representative of three independent experiments; WT PBS (n = 4), Glrx1−/− PBS (n = 4), WT HDM (n = 4), and Glrx1−/− HDM (n = 4). EOS, eosinophils; LYMPH, lymphocytes; MACS, macrophages; MPO, myeloperoxidase; PMN, polymorphonuclear neutrophils.

