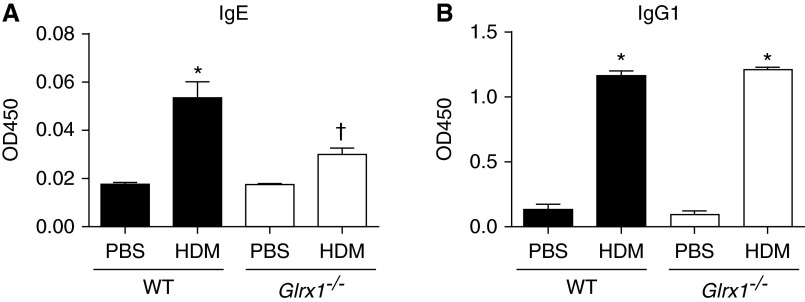
Figure 3.
Assessment of HDM-induced serum IgG1 and IgE in WT and Glrx1−/− mice. (A) Assessment of total HDM-specific IgE and (B) IgG1 in the serum in WT and Glrx1−/− mice. Serum Ig levels were measured by ELISA. Shown are corrected optical density at 450 nm (OD450) values. Data are expressed as means (± SEM) of six mice per group. *P < 0.05 (ANOVA) compared with PBS controls; †P < 0.05 (ANOVA) compared with WT mice challenged with HDM.

