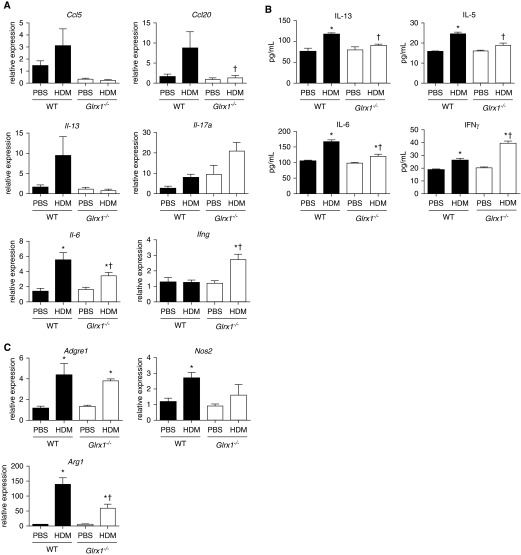
Figure 4.
Analysis of HDM-induced cytokine mRNA expression and protein levels. (A) mRNA expression of Ccl5 (regulated upon activation, normal T cell expressed and secreted), Ccl20, Il-13, Il-17a, Il-6, and Ifng from whole-lung homogenates of WT and Glrx1−/− mice was analyzed by real-time RT-PCR. Results were normalized to the housekeeping gene cyclophilin. Data are expressed as fold increases in expression compared with WT PBS controls. Data are expressed as means (± SEM) of 6 mice per group. *P < 0.05 (ANOVA) compared with PBS controls; †P < 0.05 (ANOVA) compared with WT mice challenged with HDM. (B) IL-13, IL-5, IL-6, and IFN-γ levels were measured in whole lung homogenates by ELISA. Data are expressed as means (± SEM) of six mice per group. *P < 0.05 (ANOVA) compared with PBS controls; †P < 0.05 (ANOVA) compared with WT mice challenged with HDM. (C) mRNA expression of Adgre (F4/80), nitric oxide synthase 2 (Nos2), and Arginase-1 (Arg1) from whole-lung homogenates of WT and Glrx1−/− mice was analyzed by real-time RT-PCR. Results were normalized to the housekeeping gene cyclophilin. Data are expressed as fold increases in expression compared with WT PBS controls. *P < 0.05 (ANOVA) compared with PBS controls; †P < 0.05 (ANOVA) compared with WT mice challenged with HDM.

