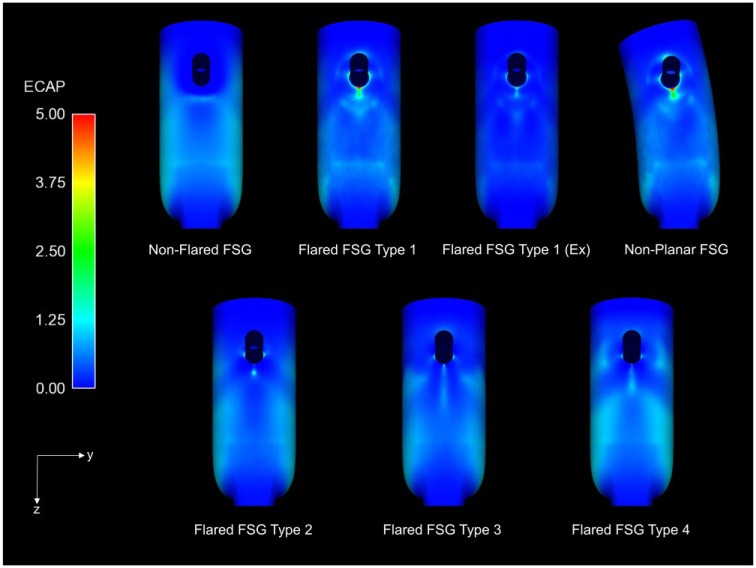
Figure 7.
Endothelial cell activation potential (ECAP) contours for all the analyzed fenestrated stent-grafts (FSGs) in the sagittal plane. High ECAP values for all the flared geometries can be seen concentrated at the renal ostia. Ex refers to during exercise, while nonplanar FSG refers to nonplanar flared FSG.

