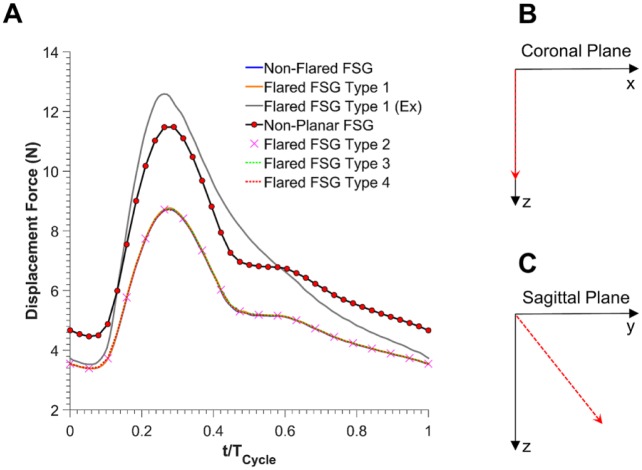
Figure 8.
(A) Magnitude of the resultant displacement forces experienced by all the fenestrated stent-grafts (FSGs). (B) Direction of the displacement force acting on all the planar FSGs is shown by a red dashed arrow in the coronal plane. Angles with x and z were 90°, respectively, and this angle was constant over the entire cardiac cycle. (C) Direction of the displacement force acting on the nonplanar flared FSG is shown by red dashed arrow in the sagittal plane. Angles with y and z were 51° and 39°, respectively, and these angles were constant over the entire cardiac cycle. Ex refers to during exercise.

