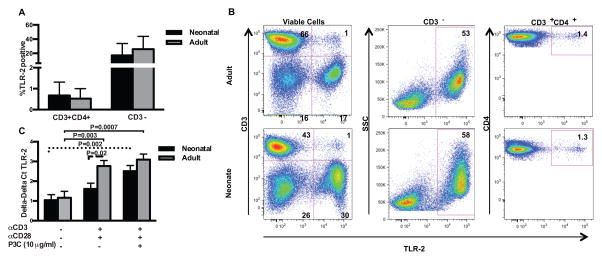
Figure 1. TLR-2 mRNA and TLR-2 surface expression in adult and neonatal CD4+ T cells.
To assess for TLR-2 expression on resting CBMC and PBMC, freshly thawed, un-fractionated CBMC and PBMC specimens were stained with anti-CD3-PE, anti-CD4-PECy7, and anti-TLR-2-Alexa 647. Shown are percentage of CD3+CD4+ and CD3-cells with TLR-2 surface expression in 12 neonatal and 12 adult samples (A; shown are mean values ± SD). Data were analyzed using two-way ANOVA followed by Tukey-Kramer adjustment for multiple comparisons. There were no statistically significant differences in surface expression of TLR-2 between adult and neonatal donors (p > 0.05). Representative dot plots from an adult and neonatal donor are shown (B). Changes in TLR-2 mRNA expression were evaluated by RT-PCR in purified adult and neonatal naïve CD4+ T cells stimulated for 18 h as indicated (n=6 both age groups; C). Repeated measures ANOVA with technical replicates as a within subject factor was used to compare mean responses under different stimulation conditions, and to compare neonatal and adult responses. Tukey-Kramer adjustment was performed to adjust for multiple comparisons. Adjusted p values < 0.05 were considered significant and are indicated in figure. Dashed lines indicate comparisons within neonatal group, solid lines indicate comparisons within adult group, and long dashed line indicates comparisons between neonatal and adult donors.

