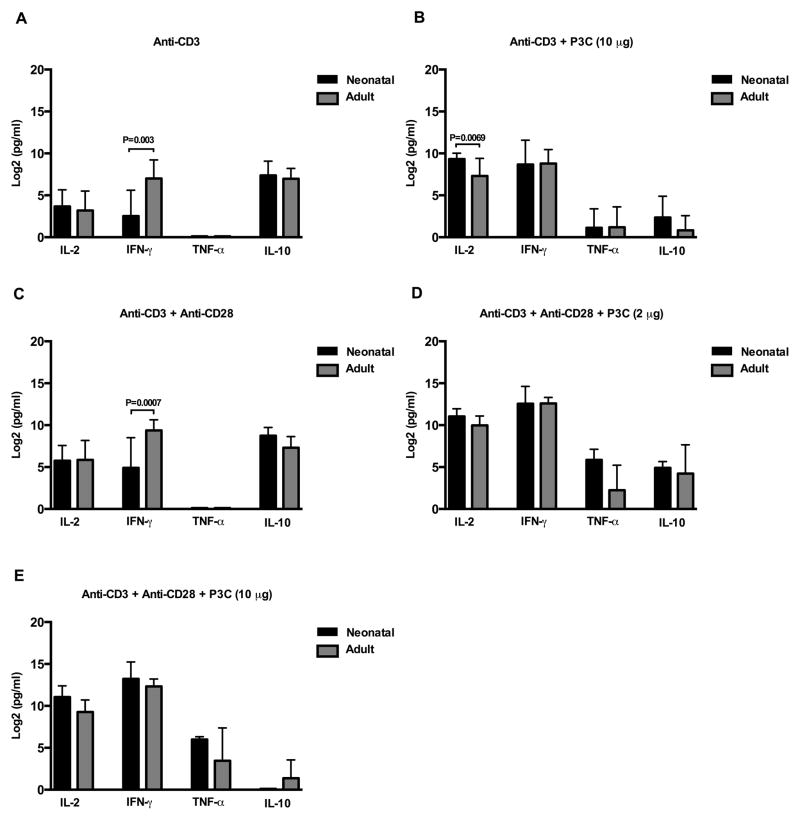
Figure 6. Comparison between adult and neonatal TLR-2 induced cytokine responses.
Purified neonatal and adult naïve CD4+CD45RA+ T cells were stimulated as indicated in triplicate. Culture supernatants were harvested at 18 h (IL-2 and TNF-α) and 72 h (IFN-γ and IL-10), and cytokine production measuring using commercial ELISAs. As IL-2 was present in culture medium, resting (medium alone) values were subtracted from measured IL-2 values prior to analysis. Cytokine data was log transformed with base 2 for analysis due to the skewed distribution of data. Shown are log 2 transformed mean group responses in pg/ml ± SD from N=6–8 neonatal and N=6–8 adult donors. Repeated measures ANOVA with technical replicates as a within subject factor was used to compare neonatal and adult responses. Tukey-Kramer adjustment was performed to adjust for multiple comparisons. Adjusted p values < 0.05 were considered significant and are indicated in figure.

