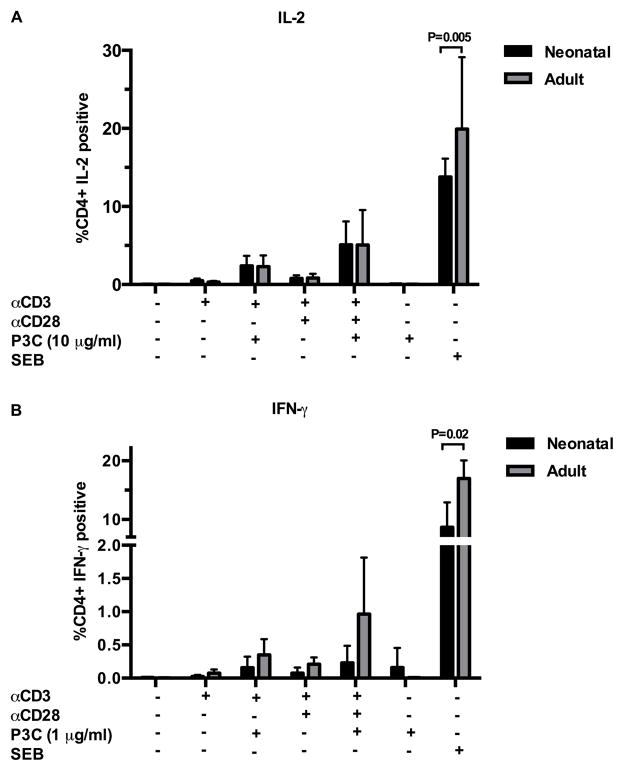
Figure 7. Percentage of CD4+CD45RA+ T cells productive of cytokine following direct TLR-2 co-stimulation.
Purified CD4+CD45RA+ T cells (see T cell stimulation assays) were stimulated as indicated in 24 well tissue culture plates for 18 – 72 h, with Brefeldin A (5 μg/ml) added during the last 12 h of incubation. Cells were harvested and stained with LIVE/DEAD Aqua and anti-CD4-PECy7, followed by fixation and permeabilization in Cytofix/Cytoperm buffer (BD) and stained with anti-IL-2-BV421 or anti-IFN-γ FITC. Expression of IL-2 (A) or IFN-γ (B) by viable CD4+ T cells was assessed by flow cytometry. Autologous, unfractionated CBMC and PBMC stimulated with Staph enterotoxin B (SEB; 5 μg/ml) were included as positive controls. Shown are mean percentages of viable CD4+ T cells with IL-2 expression ± SD (A; n=8 neonate; n=8 adult) and mean percentages of viable CD4+ T cells with IFN-γ expression ± SD (B; n=5 neonate; n=5 adult). Data were analyzed using two-way ANOVA followed by Tukey-Kramer adjustment for multiple comparisons. Adjusted p values < 0.05 were considered significant and are indicated in figure. Representative flow plots from neonatal donors are shown in Supplemental Figure 4.

